jQuery EasyUI DataGrid -Formatting Columns
The following example formats the column data in the easyui DataGrid, and uses a custom column formatter. If the price is less than 20, the text is turned red.
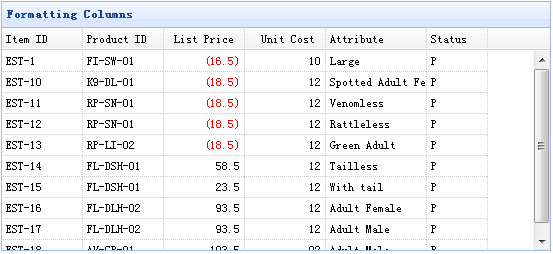
To format a DataGrid column, we need to set the formatter property, which is a function. This formatter function contains three parameters:
- value: The field value corresponding to the current column.
- row: The current row record data.
- index: The index of the current row.
Creating a DataGrid
    <table id="tt" title="Formatting Columns" class="easyui-datagrid" style="width:550px;height:250px"
            url="data/datagrid_data.json"
            singleSelect="true" iconCls="icon-save">
        <thead>
            <tr>
                <th field="itemid" width="80">Item ID</th>
                <th field="productid" width="80">Product ID</th>
                <th field="listprice" width="80" align="right" formatter="formatPrice">List Price</th>
                <th field="unitcost" width="80" align="right">Unit Cost</th>
                <th field="attr1" width="100">Attribute</th>
                <th field="status" width="60" align="center">Stauts</th>
            </tr>
        </thead>
    </table>
Please note that the 'listprice' field has a 'formatter' property, which is used to specify the formatting function.
Writing the Formatter Function
    function formatPrice(val,row){
        if (val < 20){
            return '<span style="color:red;">('+val+')</span>';
        } else {
            return val;
        }
    }
Download jQuery EasyUI Examples
jeasyui-datagrid-datagrid7.zip
Other Extensions