Unsupervised Learning - Clustering
Imagine you walk into a huge library where all the books are scattered messily on the floor. Your task is not to read every book (that would be too time-consuming), but to group them into piles based on their topics, such as science fiction, historical biographies, and cooking recipes. In this process, you don't have a ready-made classification list telling you which book belongs to which category; you rely entirely on features such as the book's content, cover, thickness, etc.,spontaneouslydiscover these groups.
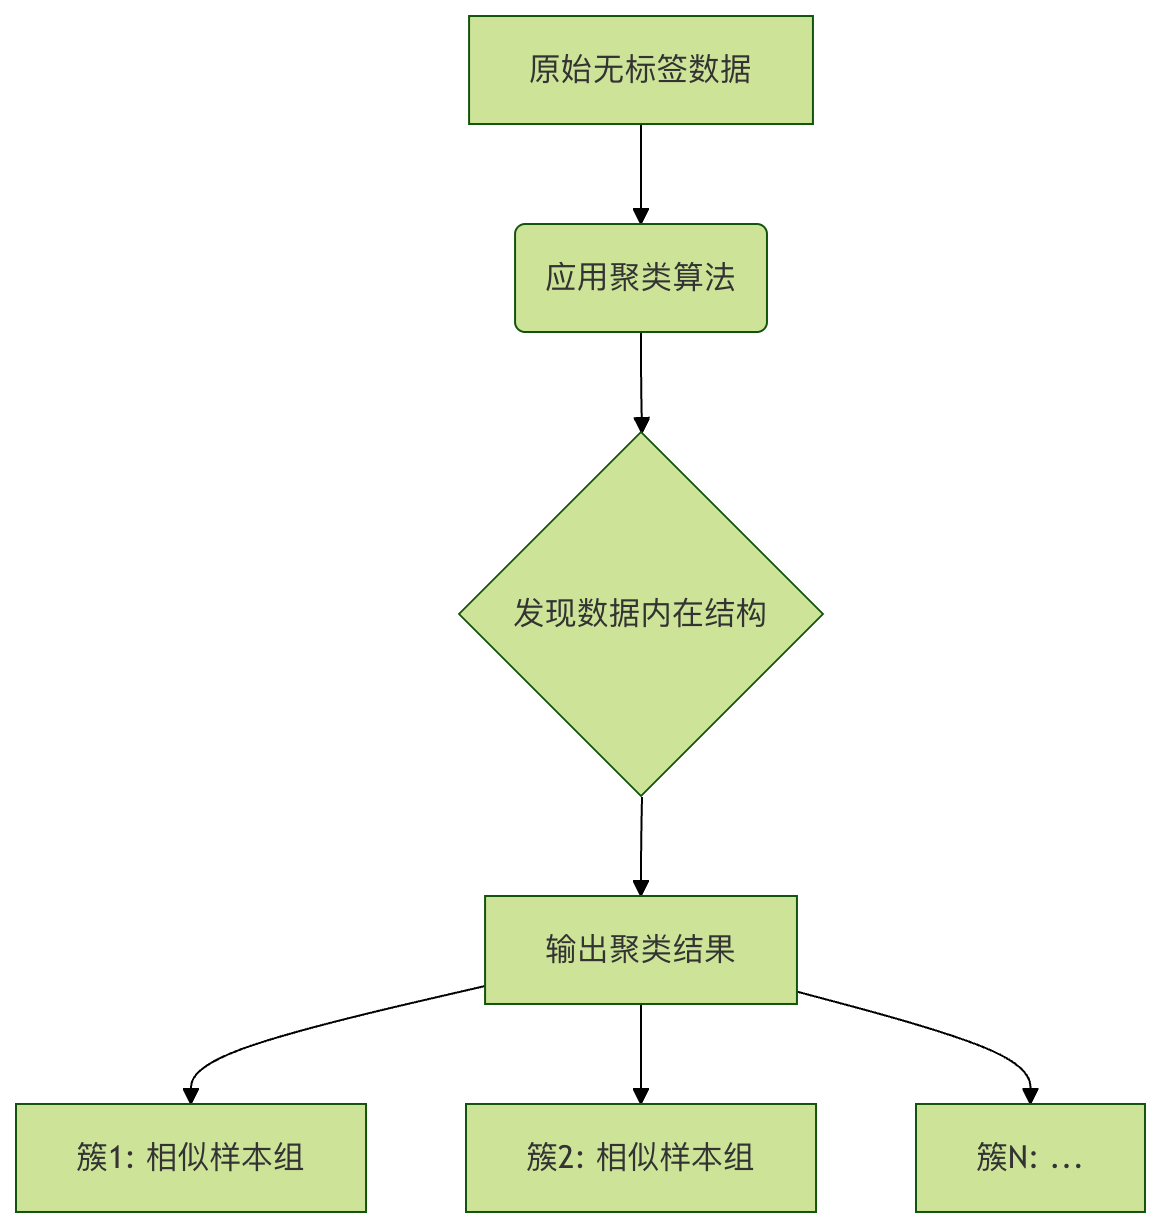
In machine learning,clusteringis exactly about doing this. It is a type ofunsupervised learningmethod whose goal is to discover the internal structure and grouping in data that has no pre-labeled answers (i.e., no "labels").
What is Unsupervised Learning and Clustering?
Before we begin, let's quickly distinguish between the two main paradigms of machine learning:
- Supervised learning: It is like learning with a teacher. We provide the algorithm with a large number of questions (feature data) and the corresponding correct answers (labels), letting it learn the mapping from questions to answers. For example, we show the algorithm many images of cats and dogs (features) and tell it whether each image is a cat or a dog (labels). After training, it can recognize new images.
- Unsupervised learning: It is like letting the machine explore and discover on its own. We only provide questions (feature data),without providing answers (labels). The algorithm's task is to find patterns, structures, or relationships from the data by itself. Clustering is one of its core techniques.
The core idea of clustering: Divide the samples in the dataset into severaldisjointsubsets (called clusters or classes), such that samples within the same cluster are mutuallysimilar, while samples in different clusters are mutuallydissimilar。
The similarity here is usually measured by mathematicaldistance(e.g., Euclidean distance).
The closer the distance, the higher the similarity.
Classic clustering algorithm: K-Means
K-MeansIt is one of the most famous and commonly used clustering algorithms, with an intuitive idea and relatively simple implementation.
Algorithm principle and steps
We can think of the K-Means process as electing representatives and re-dividing districts:
- Determine the number of clusters K: First, you need to decide how many classes you want to divide the data into. This K value must be specified in advance; it is a key parameter of K-Means.
- Initialize representatives (centroids): Randomly select K points in the data space as the initial "center point" of each cluster, which we callcentroids。
- Assign residents (samples): Calculate the distance from each sample point in the dataset to the K centroids. Following the principle of "those nearby belong to the same class," assign each sample to the cluster of the centroid that isnearestto it. In this way, all samples are divided into K clusters.
- Re-elect new representatives (update centroids): Now, each cluster has a batch of samples. Recalculate the centroid of each cluster; the new centroid is theaverage(mean point) of all sample points in that cluster.
- Repeat and converge: Repeat step 3 (assignment) and step 4 (update) until the centroid positions no longer change significantly (i.e., the algorithm converges). At this point, the cluster to which each sample belongs no longer changes either.
Code example and practice
Let's use Python'sscikit-learnlibrary and a simple dataset to demonstrate K-Means.
Example
import numpy as np
import matplotlib.pyplot as plt
from sklearn.datasets import make_blobs
from sklearn.cluster import KMeans
# -------------------------- Set Chinese font start --------------------------
plt.rcParams['font.sans-serif'] = [
# Windows preferred
'SimHei', 'Microsoft YaHei',
# macOS preferred
'PingFang SC', 'Heiti TC',
# Linux preferred
'WenQuanYi Micro Hei', 'DejaVu Sans'
]
# Fix the issue where negative signs are displayed as squares
plt.rcParams['axes.unicode_minus'] = False
# -------------------------- Set Chinese font end --------------------------
# 1. Create an artificial dataset
# We generate 300 sample points that naturally cluster around 4 centers (for our convenience in observation)
X, y_true = make_blobs(n_samples=300, centers=4, cluster_std=0.60, random_state=0)
# X is the feature data, y_true is the true class labels (used only for final comparison; the clustering algorithm will not use it)
# 2. Visualize the original data
plt.scatter(X[:, 0], X[:, 1], s=50) # s is the size of the points
plt.title("Original unlabeled data")
plt.show()
# 3. Apply K-Means clustering
# Specify to cluster into 4 classes
kmeans = KMeans(n_clusters=4, random_state=0, n_init='auto')
# Fit the model and predict the cluster label of each sample
y_kmeans = kmeans.fit_predict(X)
# 4. Obtain the centroid coordinates
centroids = kmeans.cluster_centers_
# 5. Visualize the clustering results
plt.scatter(X[:, 0], X[:, 1], c=y_kmeans, s=50, cmap='viridis')
# Mark sample points of different clusters with different colors
plt.scatter(centroids[:, 0], centroids[:, 1], c='red', s=200, alpha=0.8, marker='X')
# Mark centroid positions with red crosses, alpha is transparency
plt.title("K-Means clustering result (K=4)")
plt.show()
# Print the predicted cluster labels of the first 10 samples
print("Cluster labels of the first 10 samples:", y_kmeans[:10])
# Print centroid coordinates
print("Centroid coordinates of the four clusters:"\n", centroids)
Code explanation:
make_blobs: Generates a simulated dataset for clustering,centers=4indicates that the data is generated around 4 center points.KMeans(n_clusters=4): Creates a K-Means model instance, specifying the number of clusters K as 4.n_init='auto'is the number of times the algorithm is run, taking the best result.fit_predict(X): The core method, on the dataXfits the model and returns the cluster index (0, 1, 2, 3) for each sample.cluster_centers_: An attribute that stores the coordinates of the K centroids obtained after training.
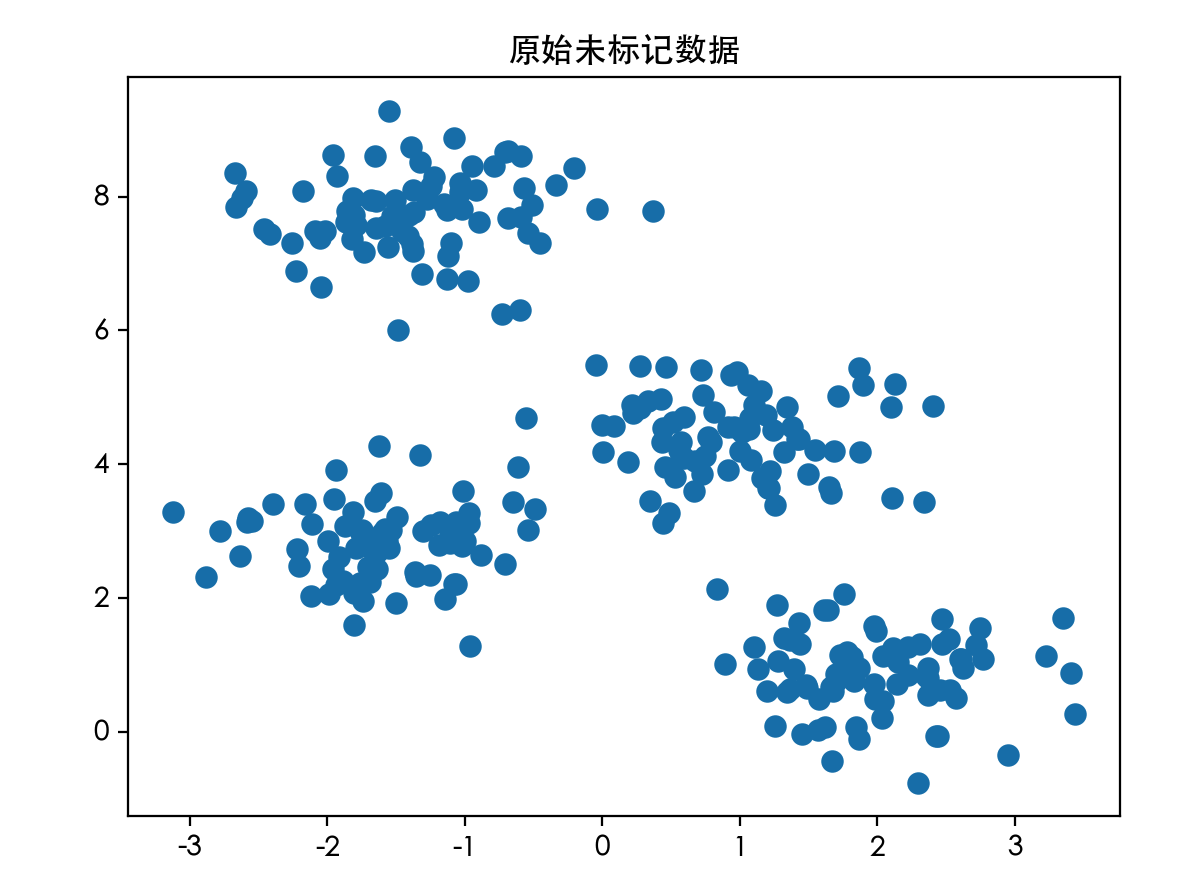
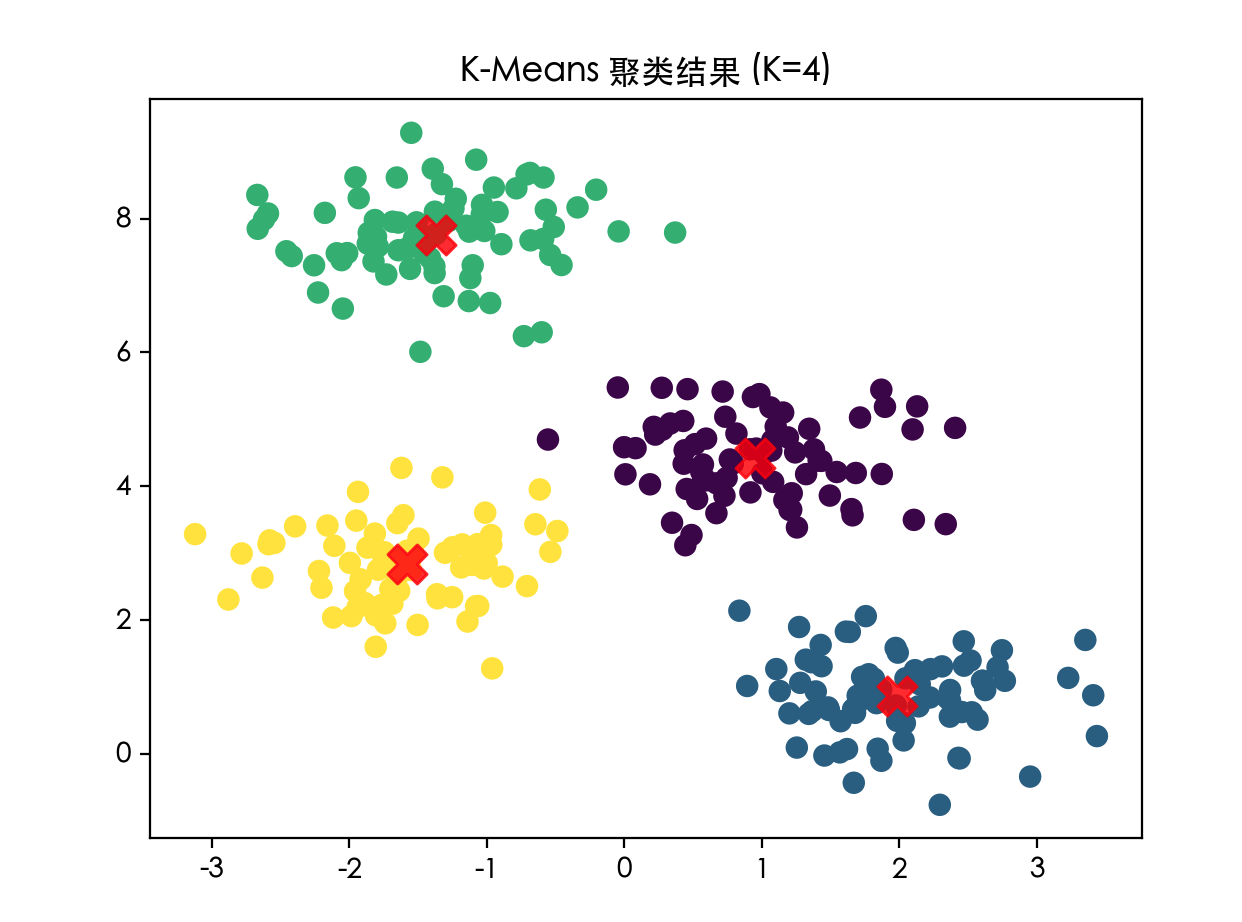
Running this code, you will see two graphs. The first is a set of messy points, while the second is clearly divided into four colored groups, with redXmarkers at the centers. That is the magic of K-Means!
前10个样本的簇标签: [1 2 0 2 1 1 3 0 2 2]
四个簇的质心坐标:
 [[ 0.94973532  4.41906906]
 [ 1.98258281  0.86771314]
 [-1.37324398  7.75368871]
 [-1.58438467  2.83081263]]
Original unlabeled data:
K-Means clustering result:
How to choose the best K value?
In the above example, because we know the data is generated around 4 centers, we easily setK=4. But in the real world, we often do not know how many classes the data should be divided into. How to choose K?
A commonly used method is the"elbow method". The idea is: as the number of clusters K increases, the average distance from sample points to the centroid of their cluster (calleddistortionorinertia) will decrease. When K is less than the true number of clusters, increasing K will greatly reduce this distance; when K reaches the true number of clusters, further increasing K causes the reduction in distance to drop sharply. This inflection point is like the elbow joint, and the corresponding K value is a better choice.
Example
inertias = []
K_range = range(1, 11) # Test K from 1 to 10
for k in K_range:
kmeans = KMeans(n_clusters=k, random_state=0, n_init='auto')
kmeans.fit(X)
inertias.append(kmeans.inertia_) # The inertia_ attribute is the SSE
# Plot the elbow curve
plt.plot(K_range, inertias, 'bo-')
plt.xlabel('Number of clusters K')
plt.ylabel('Inertia (SSE)')
plt.title('Elbow method to find the best K value')
plt.axvline(x=4, color='r', linestyle='--', alpha=0.5) # Mark the known K=4
plt.show()
Observing the generated curve, you will see that around K=4, the curve's descent speed noticeably slows down, forming an "elbow," which suggests that K=4 is a reasonable choice.
Application scenarios of clustering
Clustering is a powerful exploratory data analysis tool with extremely wide applications:
- Customer segmentation: In e-commerce or marketing, cluster based on customers' purchasing behavior and demographics (demographic characteristics) to divide them into groups such as "high-value customers" and "price-sensitive customers" for targeted marketing.
- Image segmentation: Cluster pixels in an image based on color and texture, which can be used to simplify images and identify foreground and background.
- Anomaly detection: Normal data points usually form dense clusters, while outliers are far from the center of any cluster. Clustering can be used to discover these outlier points.
- Document classification: Cluster news articles or research papers to automatically discover hot topics or research fields.
- Social network analysis: In social networks, by clustering users' relationships and interactions, communities or circles can be discovered.
Practical exercises and summary
Exercise 1: Try different K valuesModify the following in the K-Means example code above:n_clustersParameters: set them to 2, 3, 5, 8 respectively. Observe the clustering result plots and feel the impact of K value selection on the results.
Exercise 2: Use a real datasetTry usingscikit-learnbuilt-iniris(Iris) dataset for clustering. Although this dataset is usually used for classification, you can ignore its labels and only use the feature data (sepal and petal length and width) for K-Means clustering, then compare the clustering results with the true labels to see how well it works.
Example
iris = datasets.load_iris()
X_iris = iris.data # Only use feature data