VSCode Run and Debug Code
VS Code has built-in support for running and debugging Node.js applications.
In this chapter, we will use the previous sectionthe installed Python extensionto debug a Python program.
Next, let's debug the hello.py program we created earlier.
Before debugging, make sure your computer has Python 3 installed.
If your computer does not have a Python interpreter installed, a notification will pop up in the lower-right corner of the window.
Select Select Interpreter to open the command palette, and choose the Python interpreter you want to use, or install a new one.
Set breakpoints
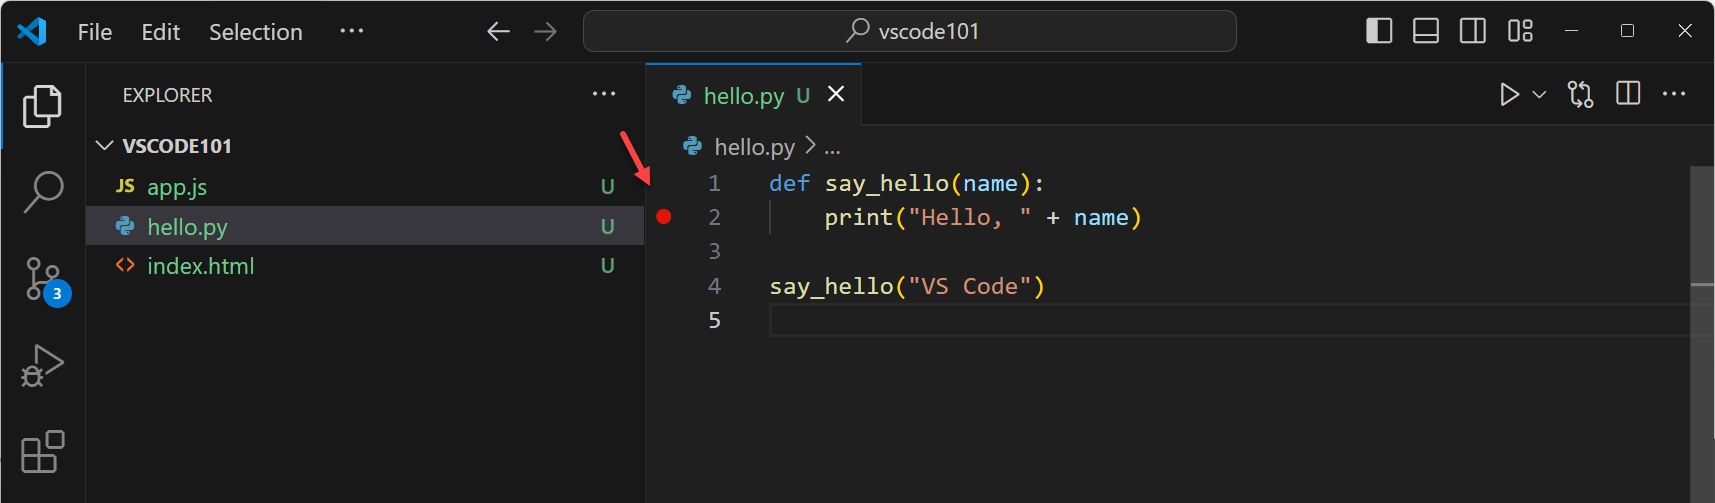
In the hello.py file, place the cursor on the print line, click the small red dot (it appears when you move the mouse over the red dot position), or pressF9key to set a breakpoint.
A red dot will appear in the left margin of the editor, indicating that a breakpoint has been set.
Breakpoints allow you to pause the program when it reaches a specific line of code, making it easier to debug.
Start a debug session
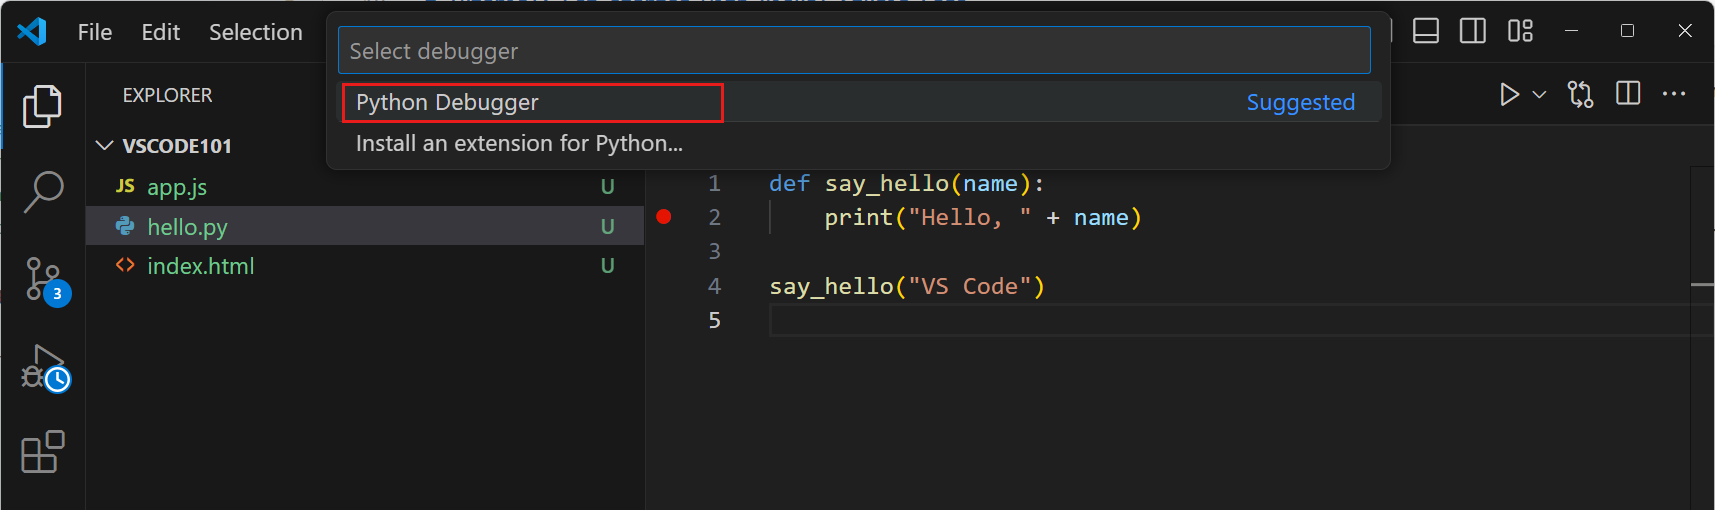
PressF5to start the debug session.
The system will prompt you to select a debugger. Choose the Python debugger.
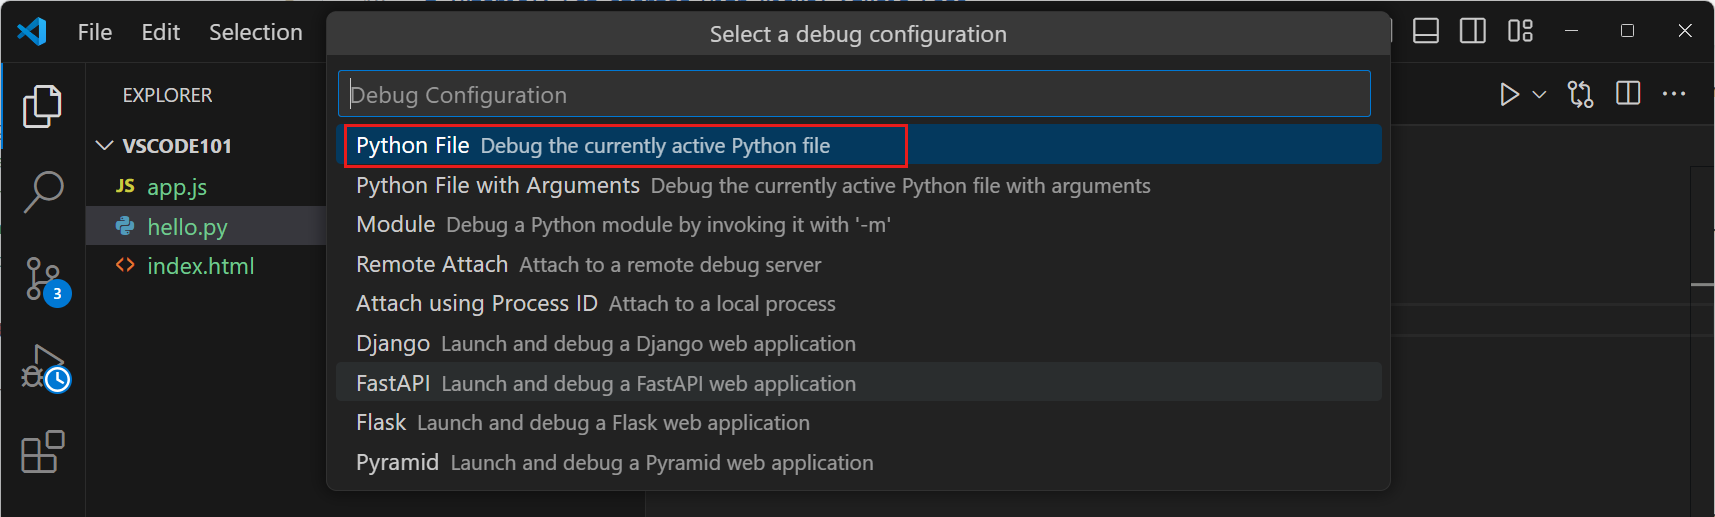
Select "Run the current Python file":
Debug code
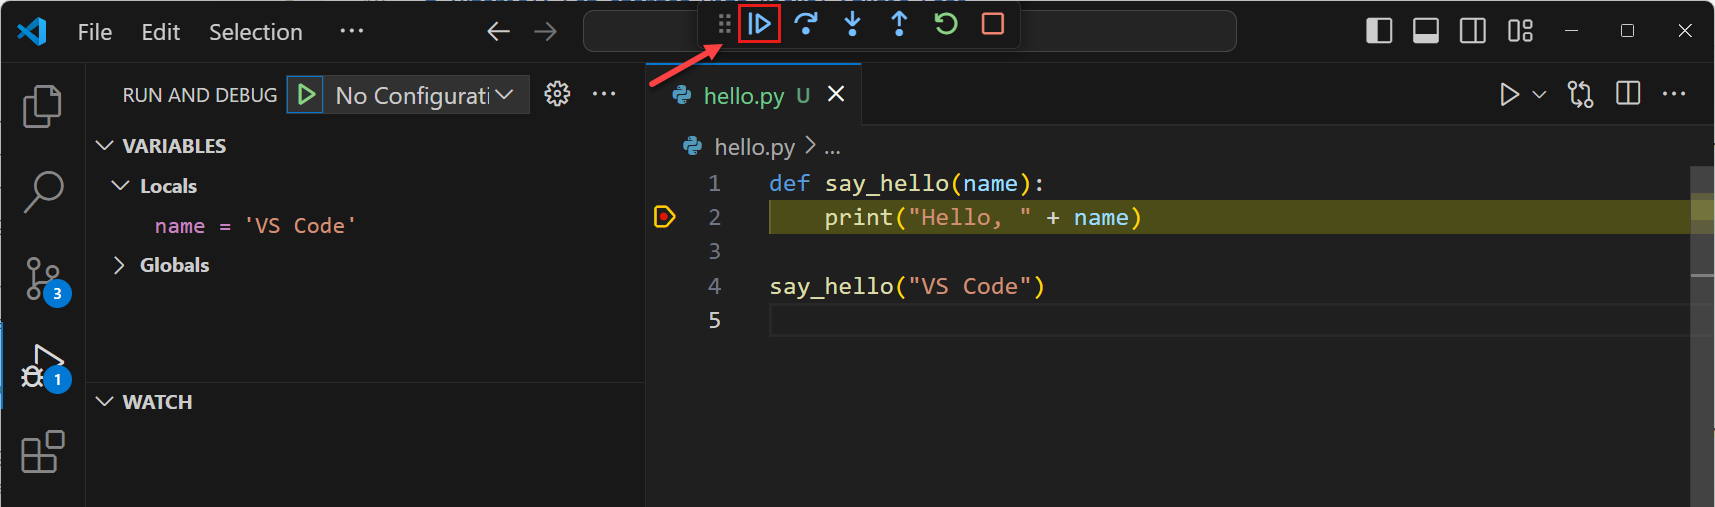
After the program starts, execution will pause at the breakpoint you set.
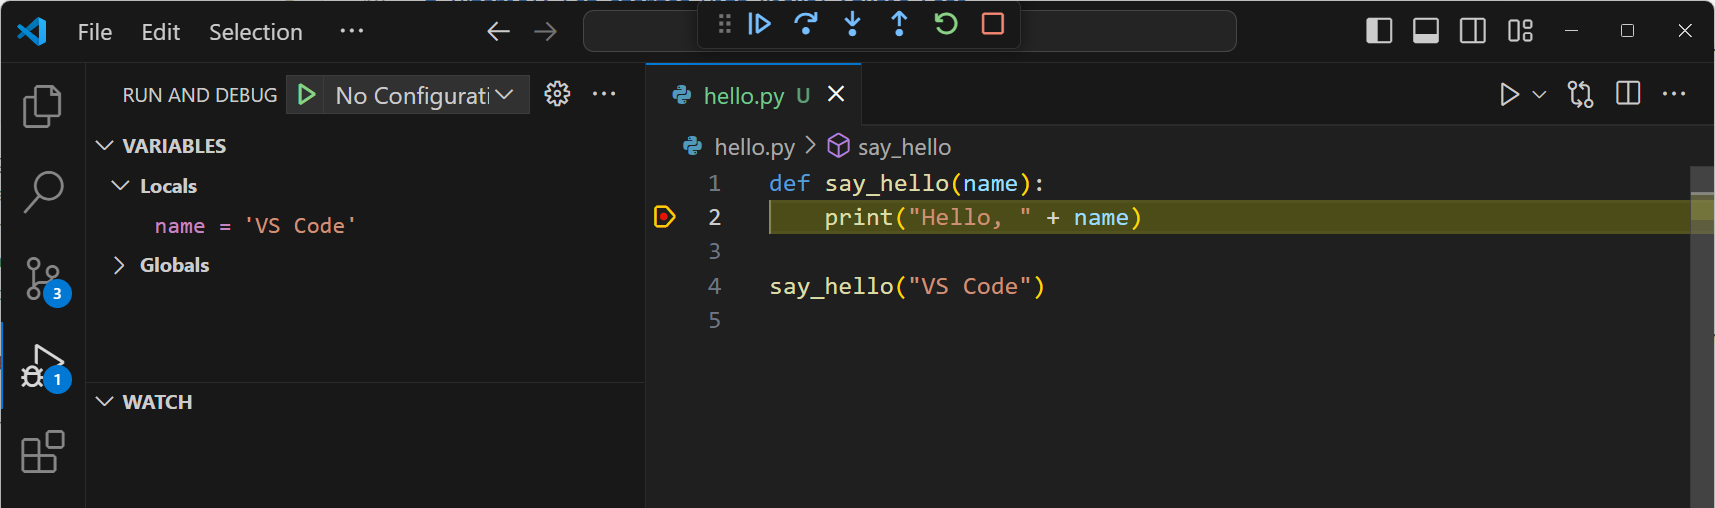
Tip:Hover over the name variable in the editor to view its value. In the Variables View of the Debug View, you can view the variable values at any time.
Continue program execution
In the debug toolbar, click the Continue button, or press F5 again to continue executing the program.
VS Code provides many advanced debugging features, such as Watch Variables, Conditional Breakpoints, and Launch Configurations.
Other Extensions