Python pyecharts module
pyecharts is a Python data visualization library based on ECharts. It allows users to use the Python language to generate various types of interactive charts and data visualizations.
ECharts is an open-source visualization library implemented in JavaScript, while Pyecharts is a Python wrapper for ECharts, making it more convenient to use ECharts in Python.
pyecharts provides a set of simple and flexible APIs, allowing users to easily create various charts, including but not limited to line charts, bar charts, scatter plots, pie charts, maps, and more.
With pyecharts, users can use Python to process and prepare data, then use concise code to generate interactive charts. These charts can be embedded in web applications or saved as static files.
pyecharts features and functions:
Simple and easy to use:Pyecharts provides an intuitive and user-friendly API, allowing users to get started quickly and generate various charts with ease.
Rich chart types:Supports a variety of common chart types, including line charts, bar charts, scatter plots, pie charts, maps, etc., to meet the needs of different scenarios.
Supports mainstream data formats:Can handle common data formats such as lists, dictionaries, Pandas DataFrames, and more.
Interactivity:The generated charts can be interactive. Users can interact with the charts by hovering the mouse, zooming, etc.
Rich configuration options:Provides a rich set of configuration options, allowing users to customize chart style, layout, and other attributes.
Theme support:Provides multiple themes. Users can choose an appropriate theme according to their needs to make the charts better match the overall style of the application.
pyecharts installation
pip installation:
pip install pyecharts
Source installation:
$ git clone https://github.com/pyecharts/pyecharts.git
$ cd pyecharts
$ pip install -r requirements.txt
$ python setup.py install
# 或者执行 python install.py
After successful installation, you can check the pyecharts version:
import pyecharts

print(pyecharts.__version__)
The output is as follows:
2.0.4
pyecharts chart types
pyecharts supports the following chart types:
| Chart type | pyecharts class | Package import |
|---|---|---|
| Line chart | Line | from pyecharts.charts import Line |
| Bar chart | Bar | from pyecharts.charts import Bar |
| Scatter plot | Scatter | from pyecharts.charts import Scatter |
| Pie chart | Pie | from pyecharts.charts import Pie |
| Radar chart | Radar | from pyecharts.charts import Radar |
| Heatmap | HeatMap | from pyecharts.charts import HeatMap |
| K-line chart | Kline | from pyecharts.charts import Kline |
| Box plot | Boxplot | from pyecharts.charts import Boxplot |
| Map | Map | from pyecharts.charts import Map |
| Word cloud | WordCloud | from pyecharts.charts import WordCloud |
| Gauge | Gauge | from pyecharts.charts import Gauge |
| Funnel chart | Funnel | from pyecharts.charts import Funnel |
| Tree diagram | Tree | from pyecharts.charts import Tree |
| Parallel coordinates chart | Parallel | from pyecharts.charts import Parallel |
| Sankey diagram | Sankey | from pyecharts.charts import Sankey |
| Geographic coordinate system chart | Geo | from pyecharts.charts import Geo |
| Timeline chart | Timeline | from pyecharts.charts import Timeline |
| 3D scatter plot | Scatter3D | from pyecharts.charts import Scatter3D |
| 3D bar chart | Bar3D | from pyecharts.charts import Bar3D |
| 3D surface chart | Surface3D | from pyecharts.charts import Surface3D |
Create the first chart
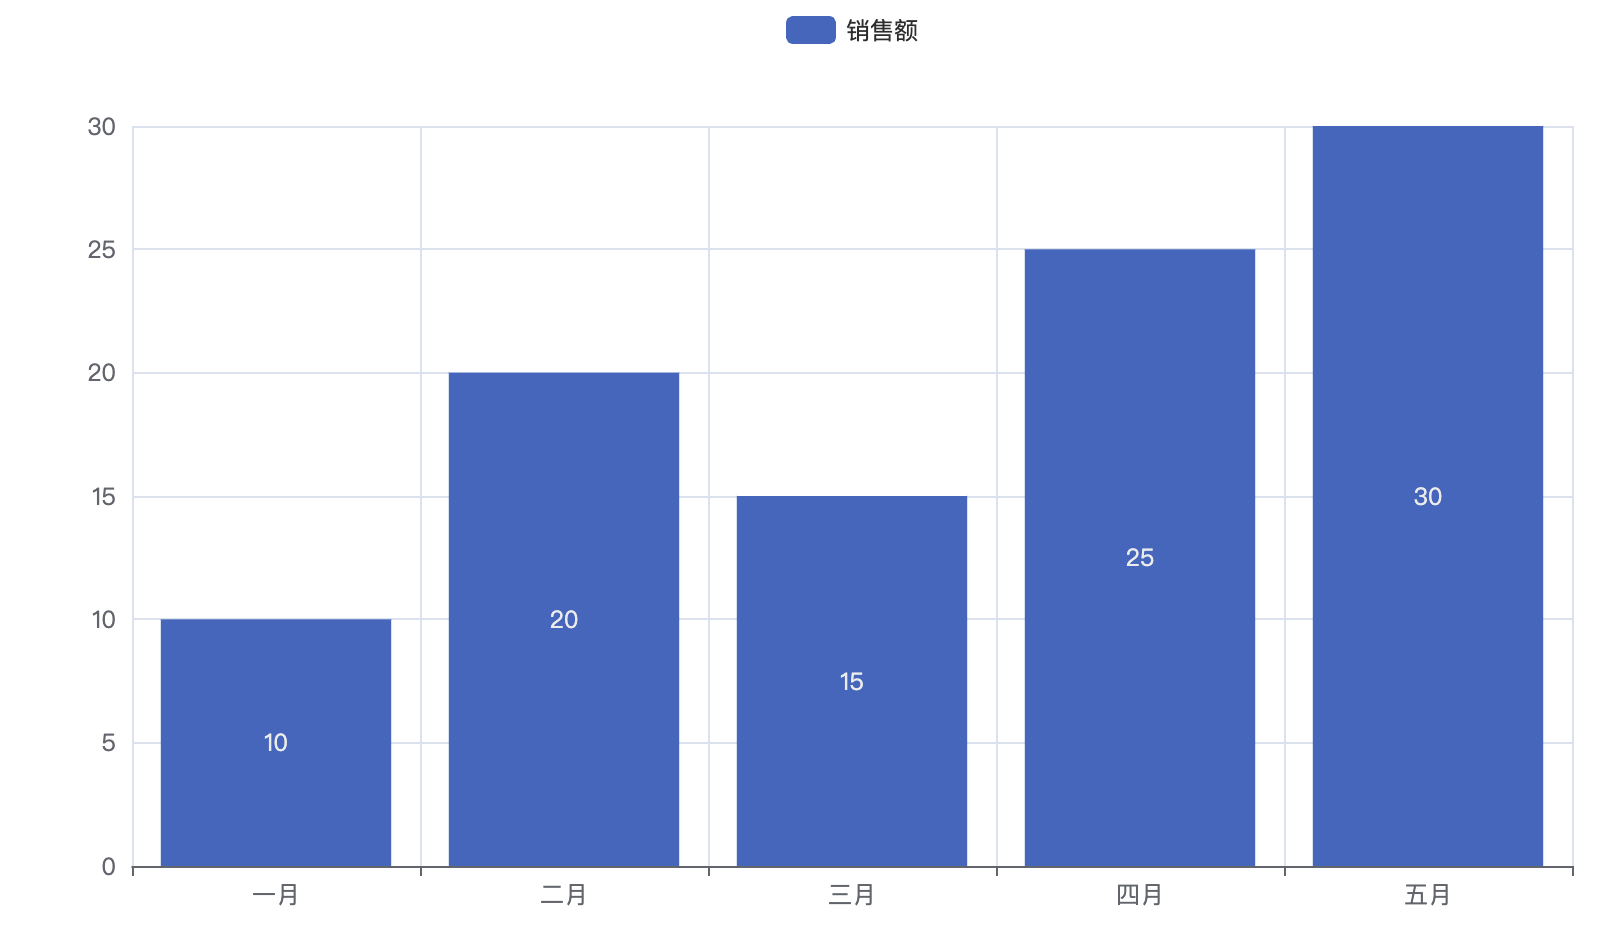
Next, we use Pyecharts to create a simple bar chart showing the sales for five months:
Example
# Prepare the data
x_data = ['January', 'February', 'March', 'April', 'May']
y_data = [10, 20, 15, 25, 30]
# Create a bar chart
bar_chart = Bar()
bar_chart.add_xaxis(x_data)
bar_chart.add_yaxis("Sales", y_data)
# You can also pass a path parameter, e.g. bar_chart.render("bar_chart.html")
bar_chart.render()
If inbar_chart.render()no file path is specified, Pyecharts will by default generate a file named "render.html" in the current working directory, i.e., the generated chart will be saved in the "render.html" file.
The execution result of the above code is:
If you want the chart file name to follow a specific naming convention, or want to specify the save path, you can provide a file path parameter in the render() method. For example:
bar_chart.render("my_bar_chart.html")
In this way, the generated chart will be saved in the "my_bar_chart.html" file in the current working directory.
Set chart configuration options
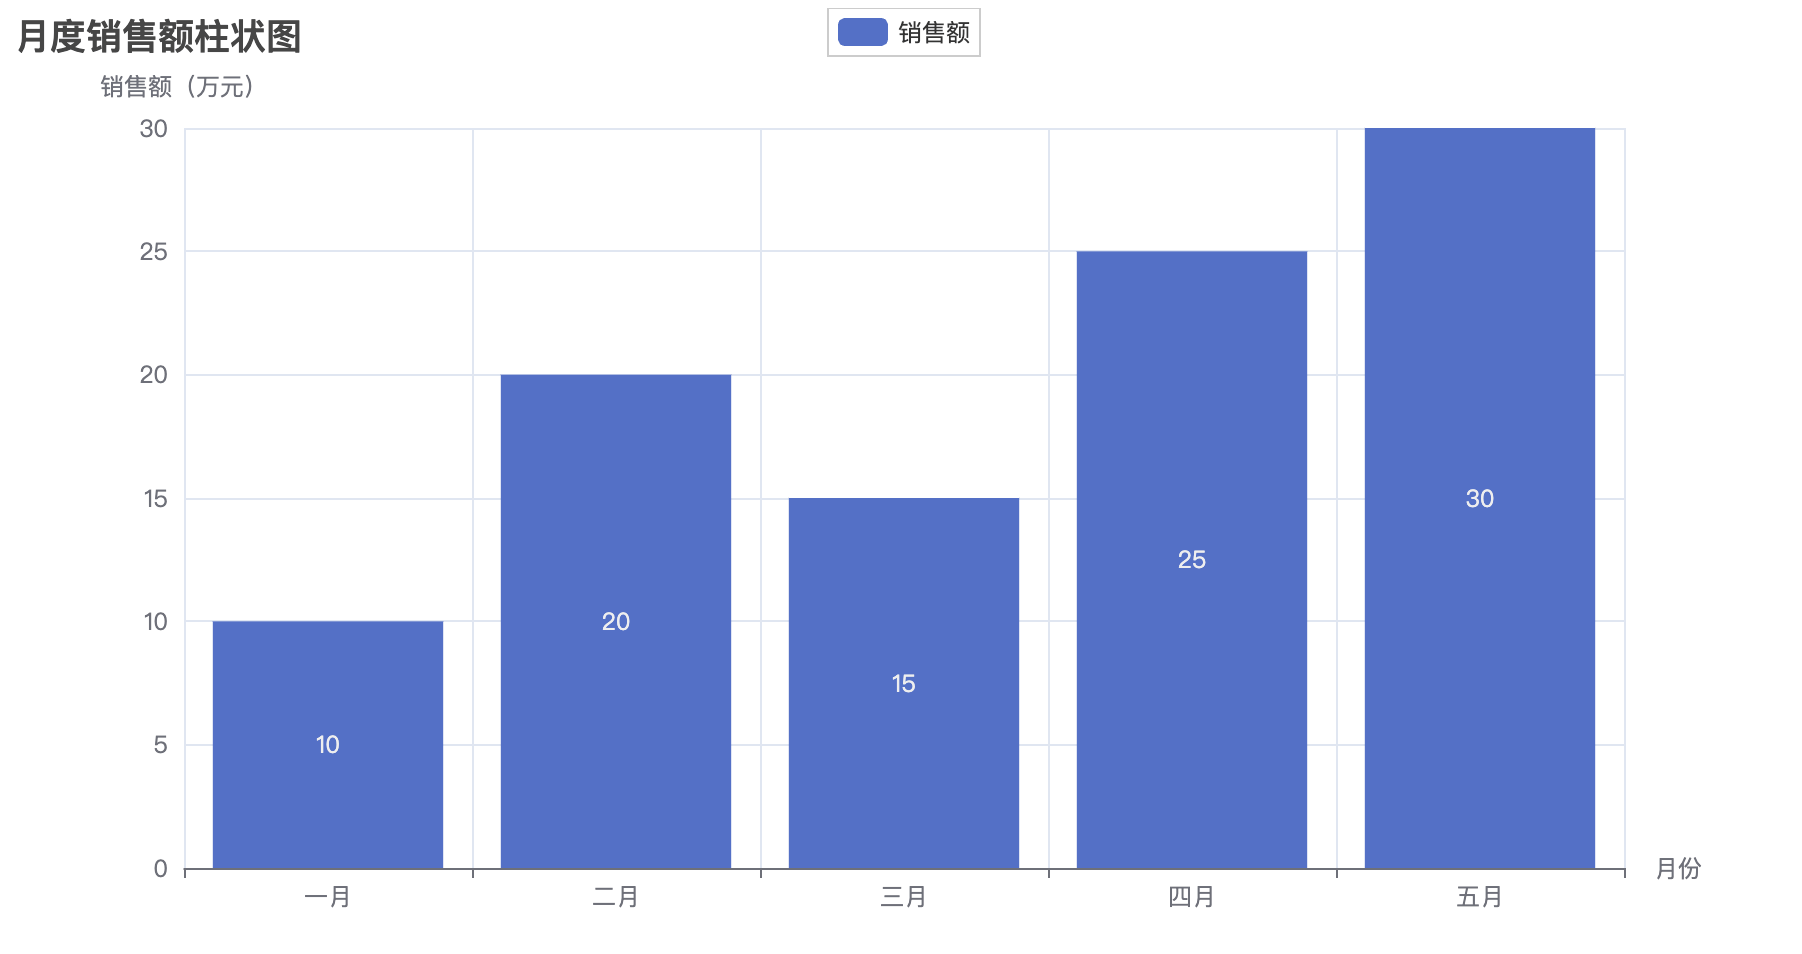
In the example, the title of the chart is "Monthly Sales Bar Chart", the x-axis is months, and the y-axis is sales. You can adjust the data and chart configuration according to actual needs:
Example
from pyecharts.charts import Bar
# Prepare the data
x_data = ['January', 'February', 'March', 'April', 'May']
y_data = [10, 20, 15, 25, 30]
# Create a bar chart
bar_chart = Bar()
bar_chart.add_xaxis(x_data)
bar_chart.add_yaxis("Sales", y_data)
# Configure the chart
bar_chart.set_global_opts(
title_opts=opts.TitleOpts(title="Monthly Sales Bar Chart"),
xaxis_opts=opts.AxisOpts(name="Month"),
yaxis_opts=opts.AxisOpts(name="Sales (10,000 yuan)"),
)
# Render the chart
bar_chart.render("bar_chart.html")
Explanation:
Bar(): Create a bar chart object.add_xaxisandadd_yaxis: Used to add data to the x-axis and y-axis, respectively.set_global_opts: Configure global options, including title, axis names, etc.
The generated chart will be saved as the "bar_chart.html" file. You can open this file in a browser to view the generated bar chart.
Using themes
pyecharts supports theme switching. Users can choose an appropriate theme according to their needs to change the style of the charts.
pyecharts provides 10+ built-in themes, and developers can also customize their favorite themes.
The following is a simple example demonstrating how to switch themes in pyecharts:
Example
from pyecharts.charts import Bar
# Built-in theme types can be found in pyecharts.globals.ThemeType
from pyecharts.globals import ThemeType
# Prepare the data
x_data = ['January', 'February', 'March', 'April', 'May']
y_data = [10, 20, 15, 25, 30]
# Create a bar chart
bar_chart = Bar(init_opts=opts.InitOpts(theme=ThemeType.LIGHT)) # Initial theme is light
bar_chart.add_xaxis(x_data)
bar_chart.add_yaxis("Sales", y_data)
# Configure the chart
bar_chart.set_global_opts(
title_opts=opts.TitleOpts(title="Monthly Sales Bar Chart"),
xaxis_opts=opts.AxisOpts(name="Month"),
yaxis_opts=opts.AxisOpts(name="Sales (10,000 yuan)"),
)
# Switch to dark theme
bar_chart.set_global_opts(theme=ThemeType.DARK)
# Render the chart
bar_chart.render("themed_bar_chart.html")
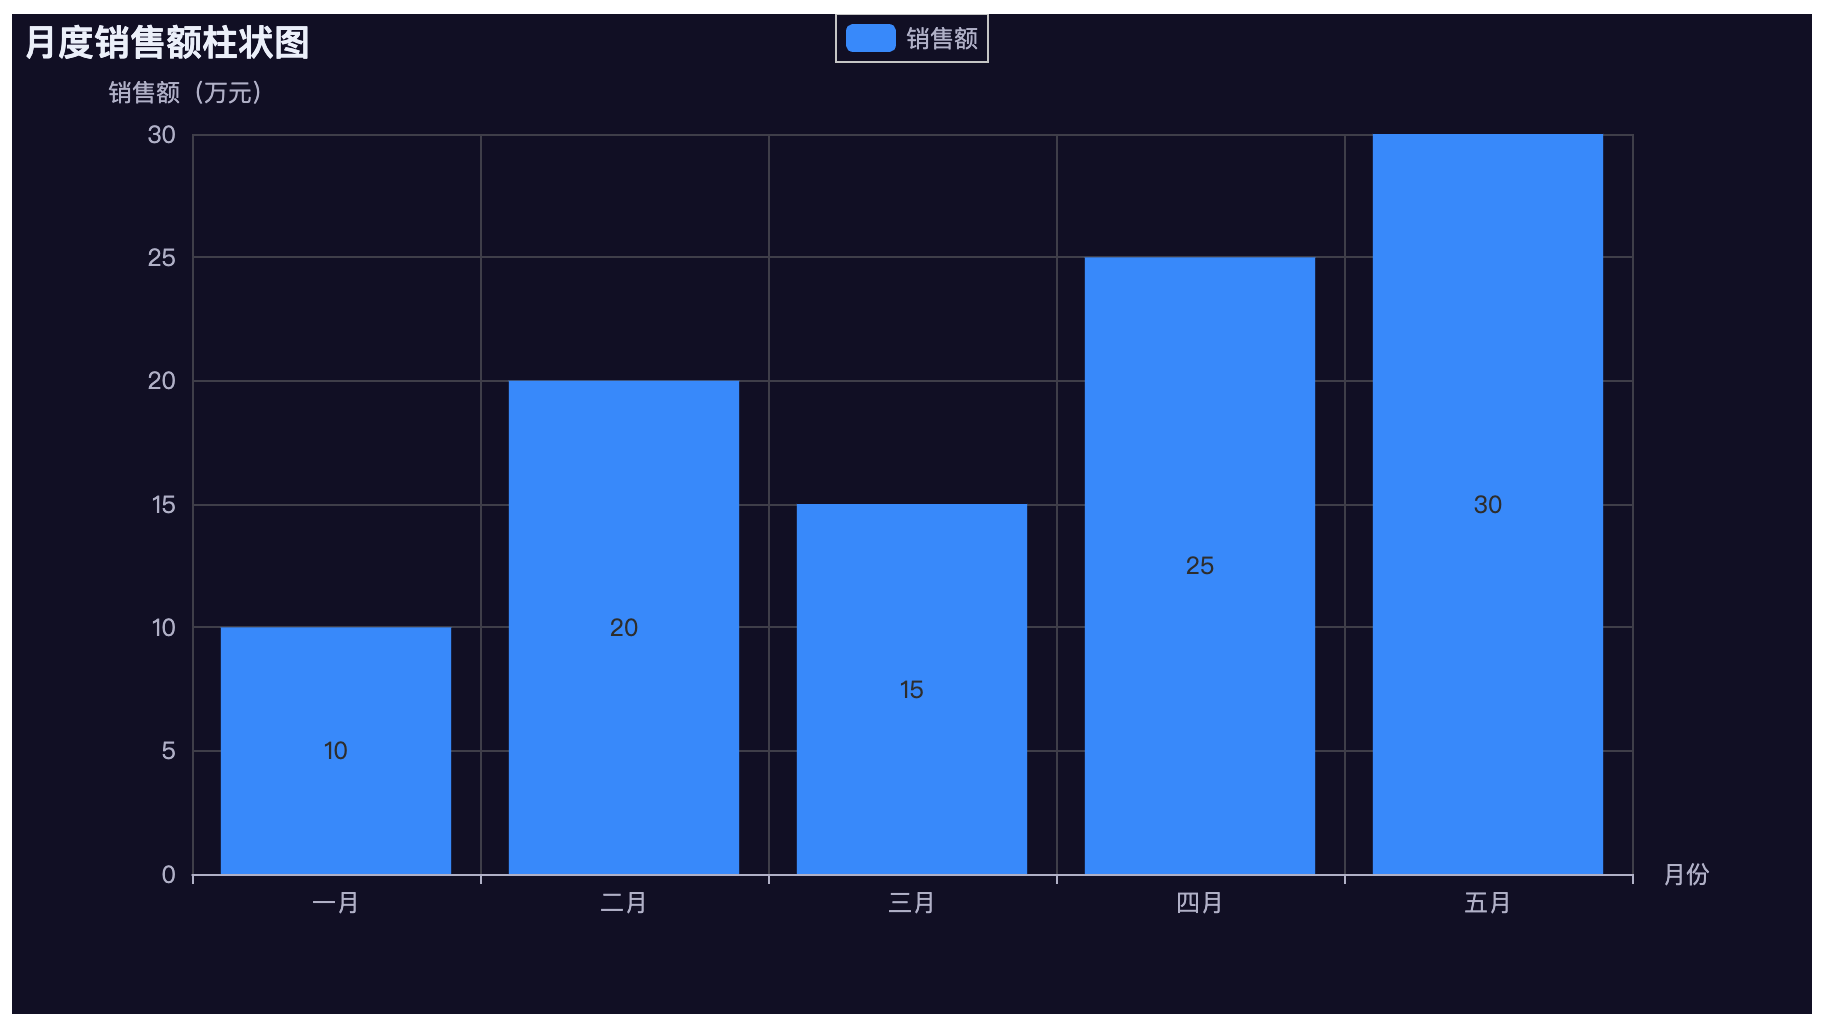
The above example demonstrates how to use in pyechartsThemeTypeto switch themes. The theme types supported by pyecharts includeLIGHT(light theme),DARK(dark theme), etc. You can choose an appropriate theme according to your needs.
init_opts=opts.InitOpts(theme=ThemeType.LIGHT): When creating a chart object, passinit_optsparameter to specify the initial theme of the chart. Here it is set to the light theme.
The generated chart is as follows:
The following is a list of themes supported by pyecharts:
Light Themes (light color schemes):
"LIGHT": Default light theme"WESTEROS": Classic warm color theme"CHALK": Chalk style theme"ESSOS": Gentle green theme"INFOGRAPHIC": Infographic theme"MACARONS": Delicious candy color theme
Dark Themes (dark color schemes):
"DARK": Default dark theme"PURPLE-PASSION": Deep purple theme"SHINE": Simple black theme"VINTAGE": Retro style theme"ROMA": Ancient Roman style theme"WALDEN": Forest dark theme
Users can create custom themes by setting custom colors and styles.
Set global configuration options
set_global_opts is a method in pyecharts used to set global configuration options. This method allows you to configure some global properties of the entire chart, such as title, axes, legend, etc.
The following are some commonly used global configuration options:
bar_chart.set_global_opts(
    title_opts=opts.TitleOpts(title="月度销售额柱状图", subtitle="副标题"),
    xaxis_opts=opts.AxisOpts(name="月份"),
    yaxis_opts=opts.AxisOpts(name="销售额(万元)"),
    legend_opts=opts.LegendOpts(pos_left="center", pos_top="top"),
    toolbox_opts=opts.ToolboxOpts(),
    tooltip_opts=opts.TooltipOpts(trigger="axis", axis_pointer_type="cross"),
)
Explanation:
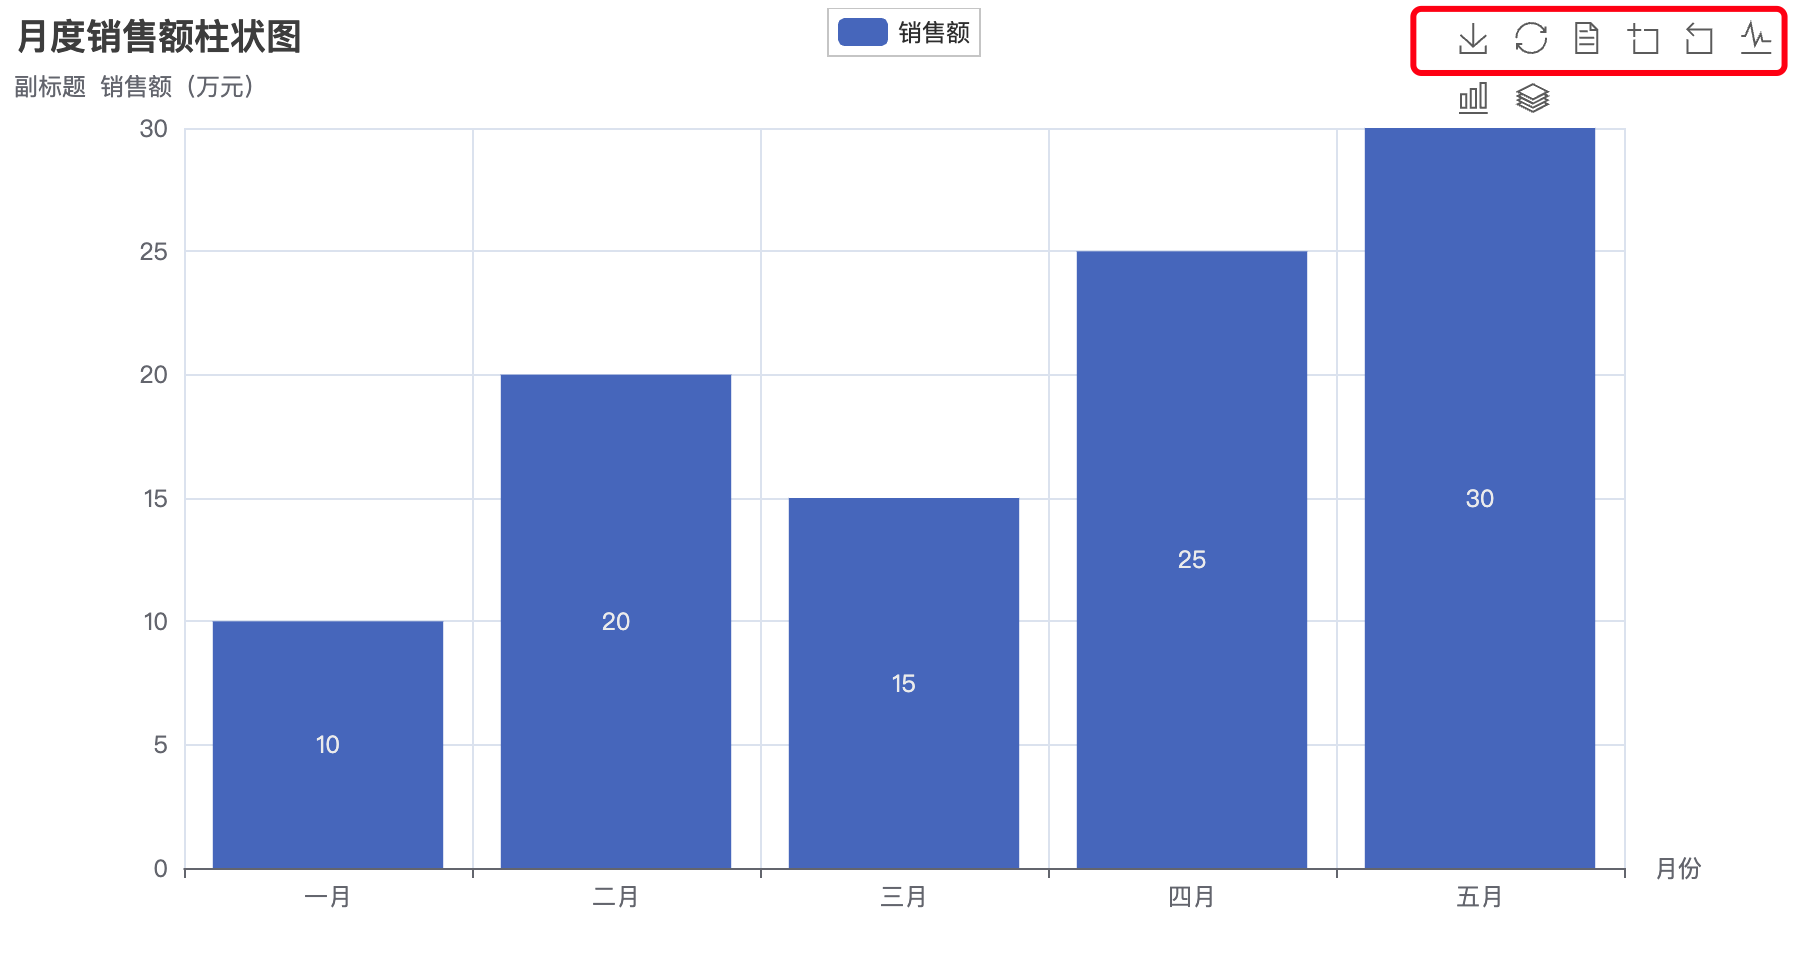
title_opts: Title configuration item, can set the main title and subtitle, as well as related style settings.xaxis_optsandyaxis_opts: Configuration items for the x-axis and y-axis, can set axis names, axis line styles, etc.legend_opts: Legend configuration item, can set the position, style, etc. of the legend.toolbox_opts: Toolbox configuration item, used to add some interactive tools, such as save as image, data view, etc.tooltip_optsTooltip configuration options, you can set the trigger method, style, etc. of the tooltip.
Example
from pyecharts.charts import Bar
# Prepare data
x_data = ['January', 'February', 'March', 'April', 'May']
y_data = [10, 20, 15, 25, 30]
# Create bar chart
bar_chart = Bar()
bar_chart.add_xaxis(x_data)
bar_chart.add_yaxis("Sales amount", y_data)
# Configure global attributes
bar_chart.set_global_opts(
title_opts=opts.TitleOpts(title="Monthly sales bar chart", subtitle="Subtitle"),
xaxis_opts=opts.AxisOpts(name="Month"),
yaxis_opts=opts.AxisOpts(name="Sales (10,000 yuan)"),
legend_opts=opts.LegendOpts(pos_left="center", pos_top="top"),
toolbox_opts=opts.ToolboxOpts(),
tooltip_opts=opts.TooltipOpts(trigger="axis", axis_pointer_type="cross"),
)
# Render chart
bar_chart.render("global_options_bar_chart.html")
The generated chart is as follows:
Other extensionsFor more pyecharts module content, refer to:https://pyecharts.org/#/zh-cn/intro