R Plotting - Function Curve Graph
Function curve graphs are an important tool for studying functions.In R, the curve() function can plot the graph of a function. The code format is as follows:
curve(expr, from = NULL, to = NULL, n = 101, add = FALSE,
      type = "l", xname = "x", xlab = xname, ylab = NULL,
      log = NULL, xlim = NULL, …)

# S3 函数的方法
plot(x, y = 0, to = 1, from = y, xlim = NULL, ylab = NULL, …)
Note:R language has S3 and S4 classes. S3 classes are more widely used, simple and rough to create but flexible, while S4 classes are more refined.
Parameters:
- expr: function expression
- from and to: the start and end range of the plot
- n: an integer value, indicating the number of x values
- add: a logical value; when TRUE, it indicates adding the plot to an existing plot.
- type: the type of plot; p for points, l for lines, o for drawing both points and lines, with the line passing through the points.
- xname: the name used for the variable on the x-axis.
- xlim and ylim indicate the ranges of the x-axis and y-axis.
- xlab, ylab: label names for the x-axis and y-axis.
In the plot function, x and y represent the horizontal and vertical coordinates of the plotted graph, respectively.
Below we plot a graph of the sin(x) function:
curve(sin(x), -2 * pi, 2 * pi)
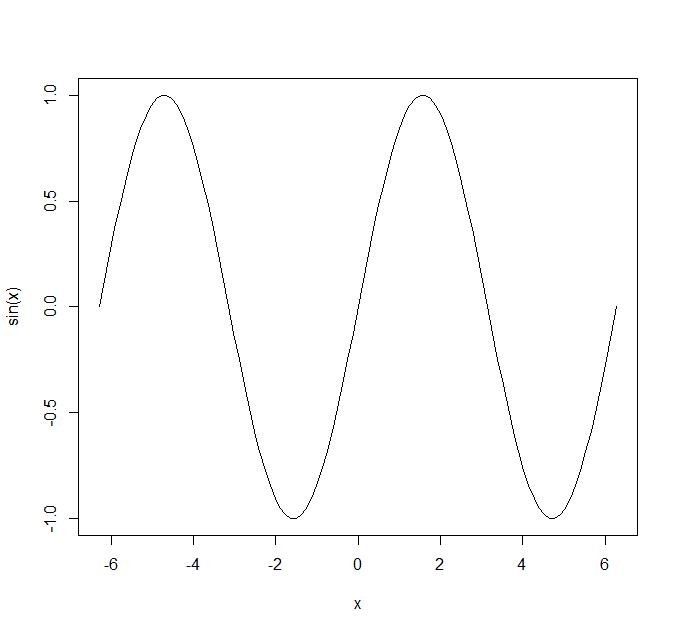
Note: Any computer plotting tool draws a schematic diagram. It cannot guarantee that it will be exactly the same as the real function graph. It simply takes a point at intervals, calculates the "height" of the point, and plots it. To ensure the continuity of the curve, adjacent points are connected by straight lines. So in some cases, such astan(x)Errors may occur:
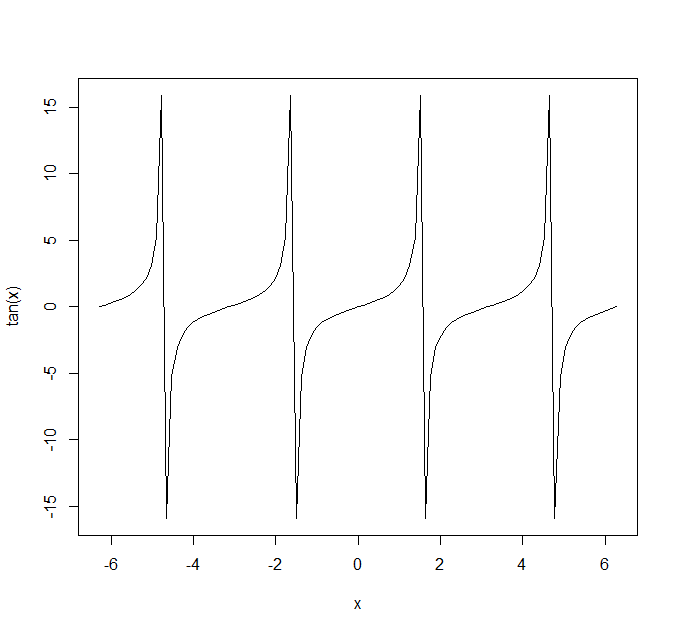
At each position of (2n+1)Pi / 2, there should be breakpoints, but R's plot connects them. I hope everyone understands this.
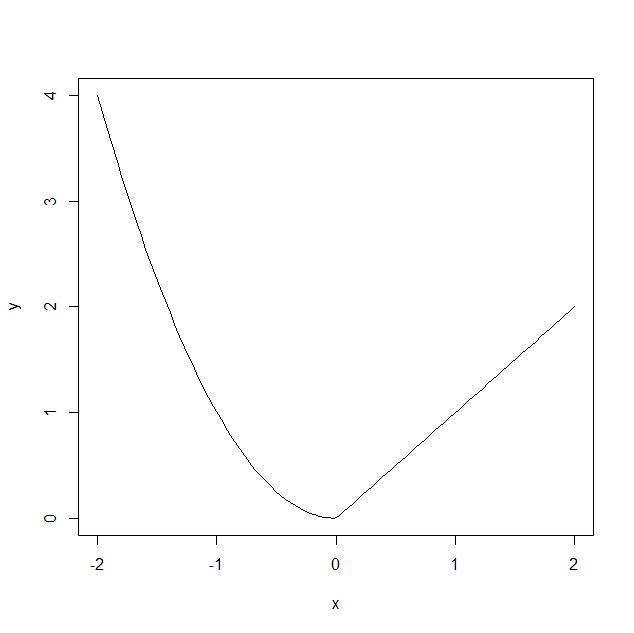
Of course, not all functions support vectorized processing like sin. We can also manually generate a numeric sequence and then use the plot function to generate the function graph. Suppose function f only supports a single numeric value as a parameter:
Example
f = function (x) {
if (x >= 0) {
x
} else {
x ^ 2
}
}
# Generate the sequence of independent variable
x = seq(-2, 2, length=100)
# Generate the sequence of dependent variable
y = rep(0, length(x))
j = 1
for (i in x) {
y[j] = f(i)
j = j + 1
}
# Plot the graph
plot(x, y, type='l')
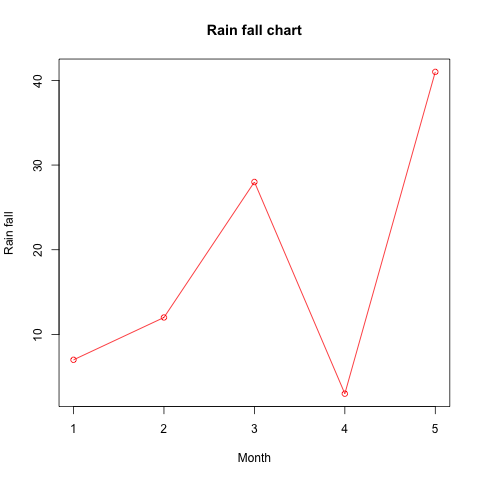
Next, we use the plot() function to plot vector data:
Example
v <- c(7,12,28,3,41)
# Generate the image
png(file = "line_chart_label_colored.jpg")
# Plot, line color is red, main parameter is used to set the title
plot(v,type = "o", col = "red", xlab = "Month", ylab = "Rain fall",
main = "Rain fall chart")