R Plotting - Bar Chart
A bar chart, also known as a bar graph, is a statistical chart that uses the length of rectangles as a variable.
Bar charts can be horizontal or vertical, and each rectangle can have a different color.
The R language uses the barplot() function to create bar charts, with the following format:
barplot(H,xlab,ylab,main, names.arg,col,beside)
Parameter description:
- HA vector or matrix containing numeric values for the chart; each value represents the height of a bar.
- xlabx-axis label.
- ylaby-axis label.
- mainChart title.
- names.argThe name of each bar.
- colThe color of each bar.
Next, let's create a simple bar chart:
Example
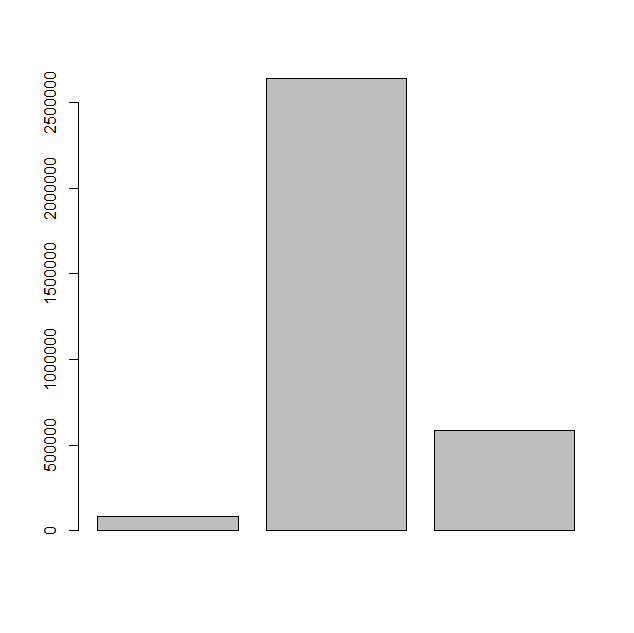
cvd19 = c(83534,2640626,585493)
# Display the bar chart
barplot(cvd19)
Executing the plotting program will generate a PDF file (Rplots.pdf) in the current directory. Open the file to see the graphical output as follows:
To convey information better, we can add a title, colors, and the name of each bar to the chart.
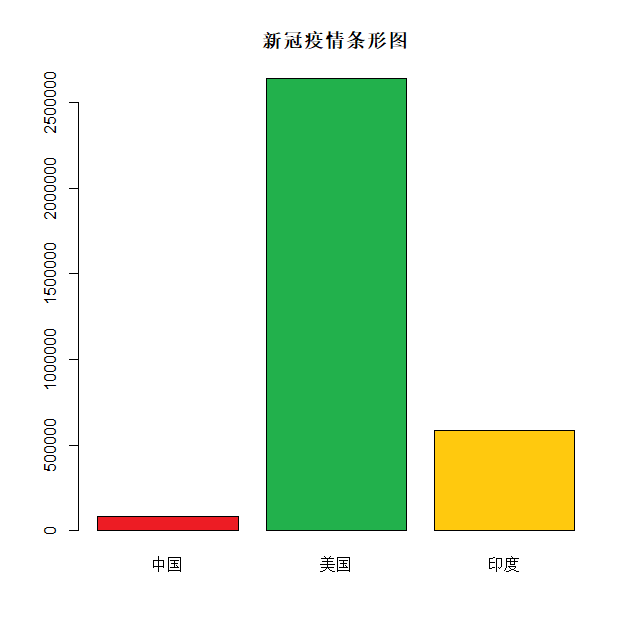
Below we create a statistical chart of the number of confirmed COVID-19 cases in China, the United States, and India as of July 1, 2020.
Chinese fonts require setting the font parameter.family='GB1':
Example
barplot(cvd19,
main="COVID-19 Bar Chart",
col=c("#ED1C24","#226AB1","#FFC90E"),
names.arg=c("China","United States","India"),
family='GB1'
)
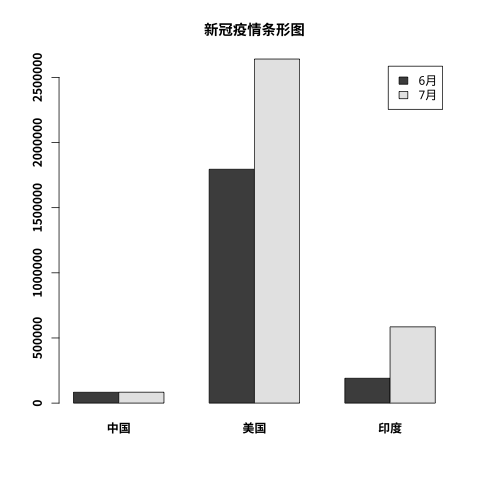
The data in barplot can be either a vector or a matrix. Now we create a comparison chart of COVID-19 cases in June and July.
First, prepare the data:
| China | United States | India | |
|---|---|---|---|
| June | 83017 | 1794546 | 190535 |
| July | 83534 | 2640626 | 585493 |
Convert it to a matrix, generate a bar chart, display it in a side-by-side format, and also show the color legend.
Here we have set up our own font library. For details, please refer toR Plotting - Chinese Support
Example
font_add("SyHei", "SourceHanSansSC-Bold.otf");
cvd19 = matrix(
c(83017, 83534, 1794546, 2640626, 190535, 585493),
2, 3
)
# Set the filename, output as png
png(file = "example-bar-1.png")
# Load font
showtext_begin();
colnames(cvd19) = c("China", "United States", "India")
rownames(cvd19) = c("June", "July")
barplot(cvd19, main = "COVID-19 Bar Chart", beside=TRUE, legend=TRUE, family='SyHei')
# Remove font
showtext_end();
The following code will generate a example-bar-1.png file in the current program directory, as shown below:
The color legend we set will be the color legend for each group:
Example
library(showtext);
font_add("SyHei", "SourceHanSansSC-Bold.otf");
cvd19 = matrix(
c(83017, 83534, 1794546, 2640626, 190535, 585493),
2, 3
)
# Set the filename, output as png
png(file = "example-bar-2.png")
# Load font
showtext_begin();
colnames(cvd19) = c("China", "United States", "India")
rownames(cvd19) = c("June", "July")
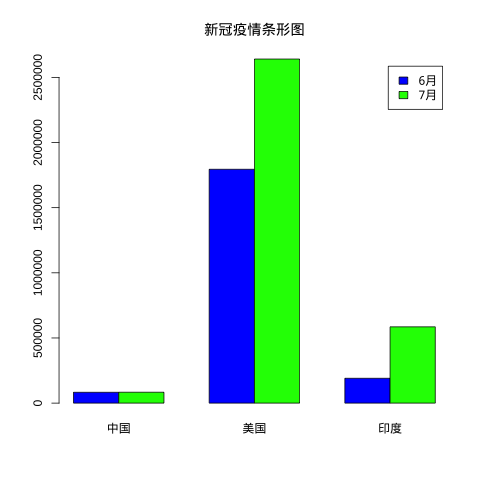
barplot(cvd19, main = "COVID-19 Bar Chart", beside=TRUE, legend=TRUE,col=c("blue","green"), family='SyHei')
# Remove font
showtext_end();
The following code will generate a example-bar-2.png file in the current program directory, as shown below:
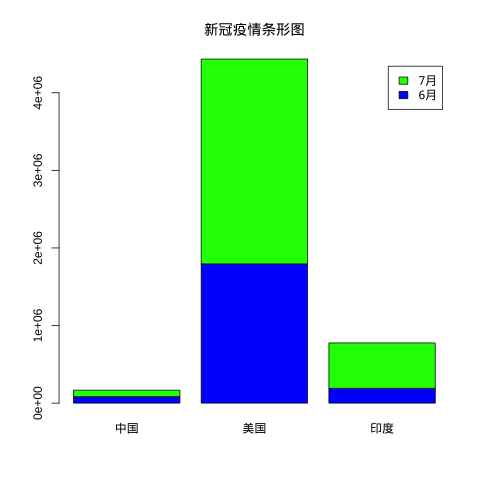
beside parameter
beside sets the way bars are stacked; the default is FALSE:
- beside=FALSEWhen FALSE, the bar height is the value in the matrix, and the bars are stacked horizontally.
- beside=TRUEWhen TRUE, the bar height is the value in the matrix, and the bars are placed side by side.
Example
font_add("SyHei", "SourceHanSansSC-Bold.otf");
cvd19 = matrix(
c(83017, 83534, 1794546, 2640626, 190535, 585493),
2, 3
)
# Set the filename, output as png
png(file = "example-bar-3.png")
# Load font
showtext_begin();
colnames(cvd19) = c("China", "United States", "India")
rownames(cvd19) = c("June", "July")
barplot(cvd19, main = "COVID-19 Bar Chart", beside=FALSE, legend=TRUE,col=c("blue","green"), family='SyHei')
# Remove font
showtext_end();
The following code will generate a example-bar-3.png file in the current program directory, as shown below: