Pandas Data Cleaning
Data cleaning is the process of handling useless data.
Many datasets contain missing data, incorrect data formats, wrong data, or duplicate data. To make data analysis more accurate, you need to process this useless data.
Common steps in data cleaning and preprocessing:
-
Missing value handling: Identify and fill missing values, or delete rows/columns containing missing values.
-
Duplicate data handling: Check and remove duplicate data to ensure each record is unique.
-
Outlier handling: Identify and handle outliers, such as extreme values and erroneous values.
-
Data format conversion: Convert data types or perform unit conversions, such as date format conversion.
-
Standardization and normalization: Standardize (e.g., Z-score) or normalize (e.g., Min-Max) numerical data.
-
Categorical data encoding: Convert categorical variables into numerical form. Common methods include One-Hot encoding and label encoding.
-
Text processing: Clean text data, such as removing stop words, stemming, tokenization, etc.
-
Data sampling: Draw samples from the dataset, or handle class imbalance through oversampling/undersampling.
-
Feature engineering: Create new features, remove irrelevant features, select important features, etc.
In this tutorial, we will use the Pandas package for data cleaning.
The test data used in this articleproperty-data.csvis as follows:
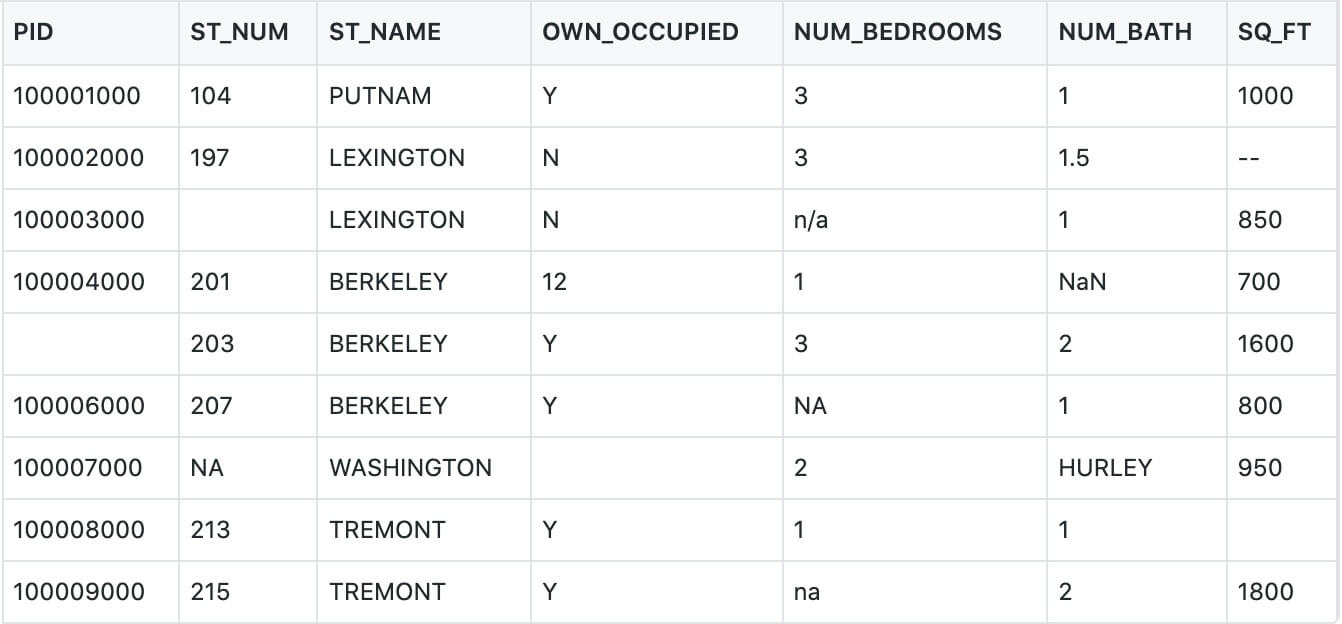
The table above contains four types of null data:
- n/a
- NA
- —
- na
Pandas Cleaning Null Values
If we want to delete rows containing empty fields, we can use thedropna()method, the syntax format is as follows:
DataFrame.dropna(axis=0, how='any', thresh=None, subset=None, inplace=False)
Parameter description:
- axis: by default,0means removing the entire row when a null value is encountered; if the parameter is set toaxis=1it means removing the entire column when a null value is encountered.
- how: by default,'any'if any data in a row (or column) contains NA, the entire row is removed; if set tohow='all'only when all values in a row (or column) are NA is the entire row removed.
- thresh: set how many non-null values are required for the data to be kept.
- subset: set the columns you want to check. If there are multiple columns, you can use a list of column names as the parameter.
- inplace: if set to True, directly overwrites the previous value with the calculated value and returns None, modifying the source data.
We can use theisnull()method to determine whether each cell is empty.
Example
df = pd.read_csv('property-data.csv')
print (df['NUM_BEDROOMS'])
print (df['NUM_BEDROOMS'].isnull())
The output result of the above example is as follows:
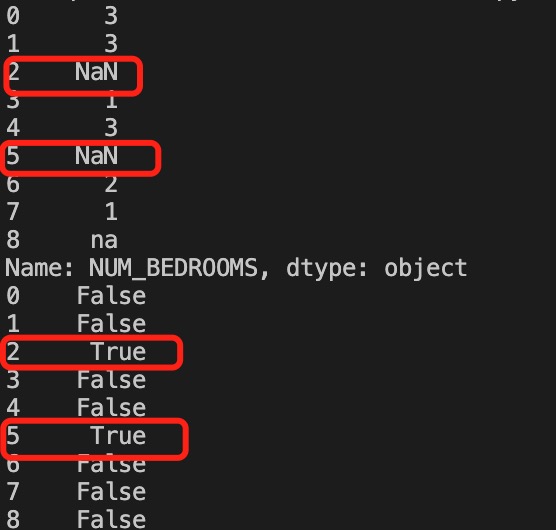
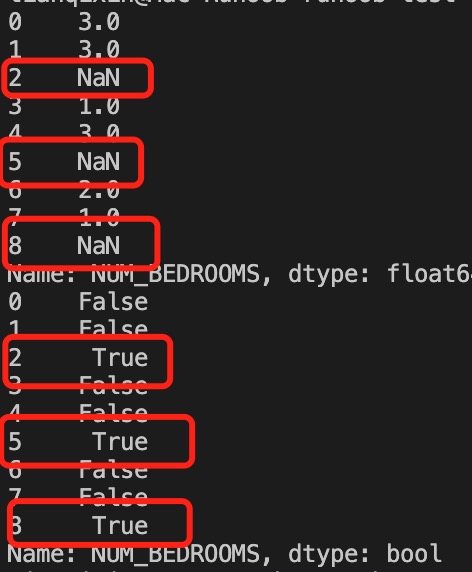
In the above example, we see that Pandas treats n/a and NA as null data, while na is not null data and does not meet our requirement. We can specify the null data type:
Example
missing_values = ["n/a", "na", "--"]
df = pd.read_csv('property-data.csv', na_values = missing_values)
print (df['NUM_BEDROOMS'])
print (df['NUM_BEDROOMS'].isnull())
The output result of the above example is as follows:
The next example demonstrates deleting rows that contain null data.
Example
df = pd.read_csv('property-data.csv')
new_df = df.dropna()
print(new_df.to_string())
The output result of the above example is as follows:

Note:By default, the dropna() method returns a new DataFrame and does not modify the source data.
If you want to modify the source DataFrame, you can use theinplace = Trueparameter:
Example
df = pd.read_csv('property-data.csv')
df.dropna(inplace = True)
print(df.to_string())
The output result of the above example is as follows:
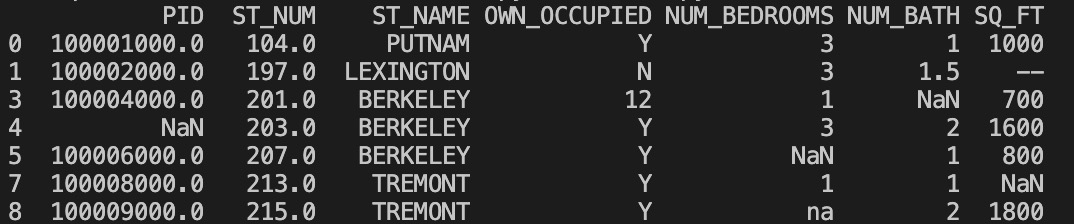
We can also remove rows where a specified column has null values:
Example
Remove rows where the field value in the ST_NUM column is empty:
df = pd.read_csv('property-data.csv')
df.dropna(subset=['ST_NUM'], inplace = True)
print(df.to_string())
The output result of the above example is as follows:
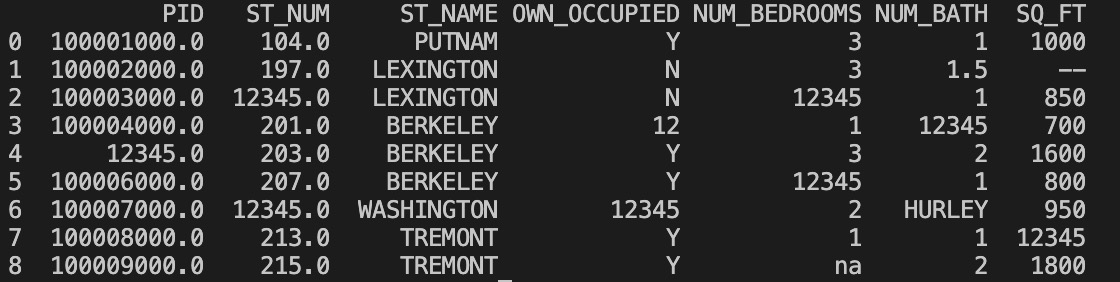
We can also use thefillna()method to replace some empty fields:
Example
Use 12345 to replace empty fields:
df = pd.read_csv('property-data.csv')
df.fillna(12345, inplace = True)
print(df.to_string())
The output result of the above example is as follows:
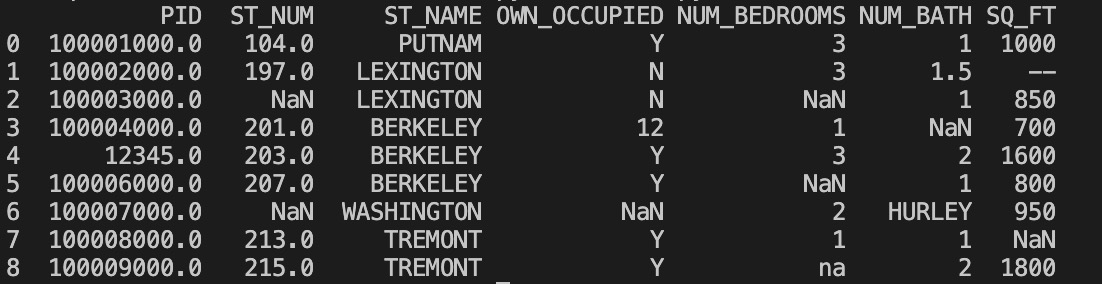
We can also specify a particular column to replace data:
Example
Use 12345 to replace null data in PID:
df = pd.read_csv('property-data.csv')
df['PID'].fillna(12345, inplace = True)
print(df.to_string())
The output result of the above example is as follows:
A common method for replacing empty cells is to calculate the mean, median, or mode of the column.
Pandas uses themean()、median()andmode()method to calculate the mean (the average of all values), the median (the middle value after sorting), and the mode (the most frequently occurring value) of a column.
Example
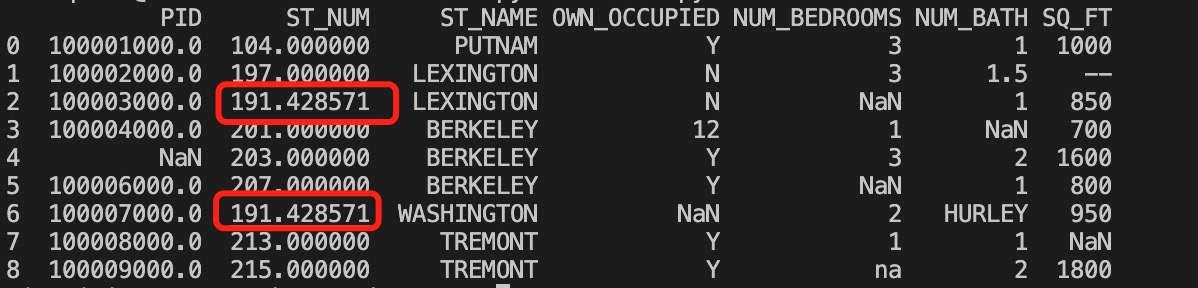
Use the mean() method to calculate the mean of the column and replace empty cells:
df = pd.read_csv('property-data.csv')
x = df["ST_NUM"].mean()
df["ST_NUM"].fillna(x, inplace = True)
print(df.to_string())
The output result of the above example is as follows, the red box is the calculated mean that replaced the empty cells:
Example
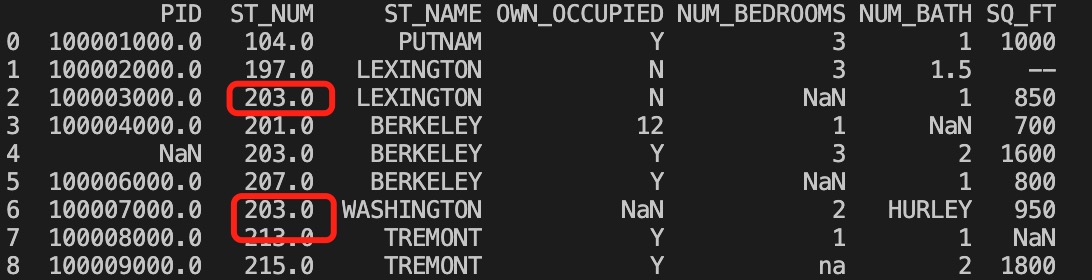
Use the median() method to calculate the median of the column and replace empty cells:
df = pd.read_csv('property-data.csv')
x = df["ST_NUM"].median()
df["ST_NUM"].fillna(x, inplace = True)
print(df.to_string())
The output result of the above example is as follows, the red box is the calculated median that replaced the empty cells:
Example
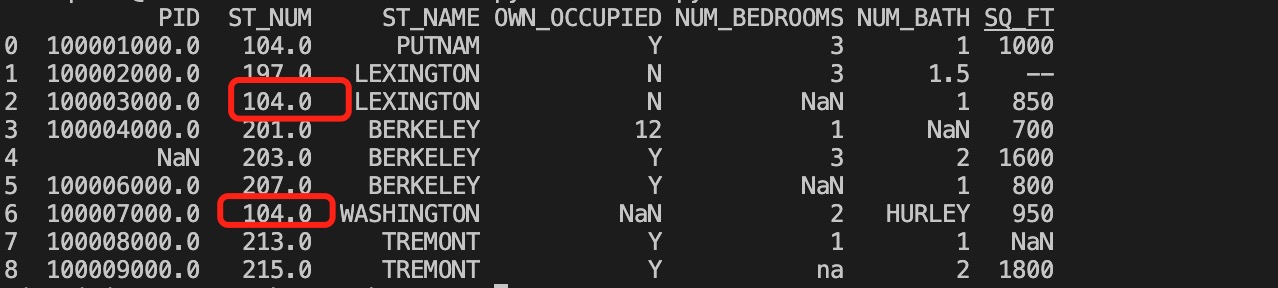
Use the mode() method to calculate the mode of the column and replace empty cells:
df = pd.read_csv('property-data.csv')
x = df["ST_NUM"].mode()
df["ST_NUM"].fillna(x, inplace = True)
print(df.to_string())
The output result of the above example is as follows, the red box is the calculated mode that replaced the empty cells:
Pandas Cleaning Incorrectly Formatted Data
Cells with incorrect data formats make data analysis difficult, or even impossible.
We can handle rows containing empty cells, or convert all cells in a column to data in the same format.
The following example formats the date:
Example
# The third date has an incorrect format
data = {
"Date": ['2020/12/01', '2020/12/02' , '20201226'],
"duration": [50, 40, 45]
}
df = pd.DataFrame(data, index = ["day1", "day2", "day3"])
df['Date'] = pd.to_datetime(df['Date'], format='mixed')
print(df.to_string())
The output result of the above example is as follows:
           Date  duration
day1 2020-12-01        50
day2 2020-12-02        40
day3 2020-12-26        45
Pandas Cleaning Incorrect Data
Data errors are also a very common situation. We can replace or remove incorrect data.
The following example replaces data with incorrect ages:
Example
person = {
"name": ['Google', 'Example' , 'Taobao'],
"age": [50, 40, 12345] # The age data 12345 is incorrect
}
df = pd.DataFrame(person)
df.loc[2, 'age'] = 30 # Modify data
print(df.to_string())
The output result of the above example is as follows:
     name  age
0  Google   50
1  Example   40
2  Taobao   30
You can also set conditional statements:
Example
Set age greater than 120 to 120:
person = {
"name": ['Google', 'Example' , 'Taobao'],
"age": [50, 200, 12345]
}
df = pd.DataFrame(person)
for x in df.index:
if df.loc[x, "age"] > 120:
df.loc[x, "age"] = 120
print(df.to_string())
The output result of the above example is as follows:
     name  age
0  Google   50
1  Example  120
2  Taobao  120
You can also delete rows with incorrect data:
Example
Delete rows where age is greater than 120:
person = {
"name": ['Google', 'Example' , 'Taobao'],
"age": [50, 40, 12345] # The age data 12345 is incorrect
}
df = pd.DataFrame(person)
for x in df.index:
if df.loc[x, "age"] > 120:
df.drop(x, inplace = True)
print(df.to_string())
The output result of the above example is as follows:
     name  age
0  Google   50
1  Example   40
Pandas Cleaning Duplicate Data
If we want to clean duplicate data, we can use theduplicated()anddrop_duplicates()method.
If the corresponding data is duplicate,duplicated()it will return True, otherwise it will return False.
Example
person = {
"name": ['Google', 'Example', 'Example', 'Taobao'],
"age": [50, 40, 40, 23]
}
df = pd.DataFrame(person)
print(df.duplicated())
The output result of the above example is as follows:
0    False
1    False
2     True
3    False
dtype: bool
To remove duplicate data, you can directly use thedrop_duplicates()method.
Example
persons = {
"name": ['Google', 'Example', 'Example', 'Taobao'],
"age": [50, 40, 40, 23]
}
df = pd.DataFrame(persons)
df.drop_duplicates(inplace = True)
print(df)
The output result of the above example is as follows:
     name  age
0  Google   50
1  Example   40
3  Taobao   23
Common Methods and Descriptions
Common methods for data cleaning and preprocessing:
| Operation | Method/Step | Description | Common Functions/Methods |
|---|---|---|---|
| Missing Value Handling | Fill Missing Values | Fill missing values with a specified value (such as mean, median, mode, etc.). | df.fillna(value) |
| Delete Missing Values | Delete rows or columns containing missing values. | df.dropna() | |
| Duplicate Data Handling | Delete Duplicate Data | Delete duplicate rows in the DataFrame. | df.drop_duplicates() |
| Outlier Handling | Outlier Detection (Based on Statistical Methods) | Identify and handle outliers using the Z-score or IQR method. | Custom function (such as based on Z-score or IQR) |
| Replace Outliers | Replace outliers with appropriate values (such as mean or median). | Custom function (such as replacing outliers) | |
| Data Format Conversion | Convert Data Types | Convert a data type from one type to another, such as converting a string to a date. | df.astype() |
| Date/Time Format Conversion | Convert strings or numbers to datetime type. | pd.to_datetime() | |
| Standardization and normalization | Standardization | Transform data into a distribution with mean 0 and standard deviation 1. | StandardScaler() |
| Normalization | Scale data to a specified range (e.g., [0, 1]). | MinMaxScaler() | |
| Categorical data encoding | Label encoding | Convert categorical variables to integer form. | LabelEncoder() |
| One-Hot Encoding | Convert each category into a new binary feature. | pd.get_dummies() | |
| Text data processing | Remove stop words | Remove insignificant words from text, such as "the", "is", etc. | Custom function (based onnltkorspaCy) |
| Stemming and lemmatization | Extract stems or restore the base form of words. | nltk.stem.PorterStemmer() | |
| Tokenization | Split text into words or subwords. | nltk.word_tokenize() | |
| Data sampling | Random sampling | Randomly sample a certain proportion of data. | df.sample() |
| Oversampling and undersampling | Balance the class distribution in the dataset by oversampling (duplicating minority class samples) or undersampling (reducing majority class samples). | SMOTE()(Oversampling);RandomUnderSampler()(Undersampling) | |
| Feature engineering | Feature selection | Select features that influence the target variable and remove redundant or irrelevant features. | SelectKBest() |
| Feature extraction | Create new features from raw data to improve the model's predictive power. | PolynomialFeatures() | |
| Feature scaling | Scale numerical features so that they have the same magnitude. | MinMaxScaler() 、 StandardScaler() | |
| Categorical feature mapping | Feature mapping | Map categorical variables to corresponding numerical codes. | Custom mapping function |
| Data merging and concatenation | Merge data | Merge multiple DataFrames based on certain columns, supporting inner, outer, left, right joins, etc. | pd.merge() |
| Concatenate data | Concatenate multiple DataFrames by rows or columns. | pd.concat() | |
| Data reshaping | Pivot table | Group data by certain dimensions and compute aggregate results. | pd.pivot_table() |
| Data transformation | Change the shape of data, e.g., from long format to wide format or from wide format to long format. | df.melt() 、 df.pivot() | |
| Data type conversion and processing | String processing | Process string data, such as removing spaces, converting case, etc. | str.replace() 、 str.upper()wait |
| Grouped calculation | Perform aggregation after grouping by a certain feature. | df.groupby() | |
| Predictive filling of missing values | Use models to predict and fill missing values | Use machine learning models (e.g., regression models) to predict missing values and fill in missing data. | Custom model (e.g.,sklearn.linear_model.LinearRegression) |
| Time series processing | Filling missing values in time series | Use time series methods (such as forward fill, backward fill) to fill missing values. | df.fillna(method='ffill') |
| Rolling window calculation | Use a sliding window to perform statistical calculations on time series data (e.g., mean, standard deviation, etc.). | df.rolling(window=5).mean() | |
| Data conversion and mapping | Data mapping and replacement | Replace certain values in data with other values. | df.replace() |
Fill missing values:
Example
# Sample data
data = {'Name': ['Alice', 'Bob', 'Charlie', None],
'Age': [25, 30, None, 35],
'City': ['New York', 'Los Angeles', 'Chicago', 'Houston']}
df = pd.DataFrame(data)
# Fill missing "Age" with mean
df['Age'].fillna(df['Age'].mean(), inplace=True)
print(df)
Output:
      Name  Age           City
0    Alice   25.0       New York
1      Bob   30.0    Los Angeles
2  Charlie   30.0        Chicago
3     None   35.0        Houston
One-Hot Encoding:
Example
# Sample data
data = {'City': ['New York', 'Los Angeles', 'Chicago', 'Houston']}
df = pd.DataFrame(data)
# Perform One-Hot Encoding on the "City" column
df_encoded = pd.get_dummies(df, columns=['City'])
print(df_encoded)
Output:
   City_Chicago  City_Houston  City_Los Angeles  City_New York
0             0             0                 0              1
1             0             0                 1              0
2             1             0                 0              0
3             0             1                 0              0
Standardization:
Example
import pandas as pd
# Sample data
data = {'Age': [25, 30, 35, 40, 45],
'Salary': [50000, 60000, 70000, 80000, 90000]}
df = pd.DataFrame(data)
# Standardize data
scaler = StandardScaler()
df_scaled = scaler.fit_transform(df)
print(df_scaled)
Output:
[[-1.41421356 -1.41421356]
 [-0.70710678 -0.70710678]
 [ 0.          0.        ]
 [ 0.70710678  0.70710678]
 [ 1.41421356  1.41421356]]
Other extensions