Executing JavaScript in Chrome Browser
This chapter introduces how to run and debug JavaScript code in the Chrome browser.
Chrome is a free web browser developed by Google, and it is very convenient for front-end development (especially for debugging code).
Chrome official website address:https://www.google.com/intl/zh-CN/chrome/。
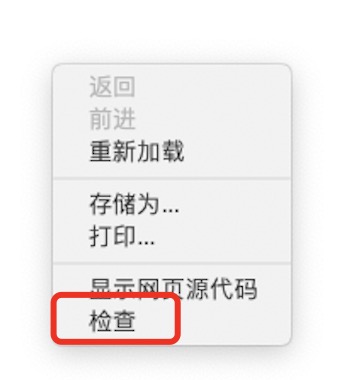
In the Chrome browser, we can press theF12button or right-click the page and select"Inspect"to open the developer tools.
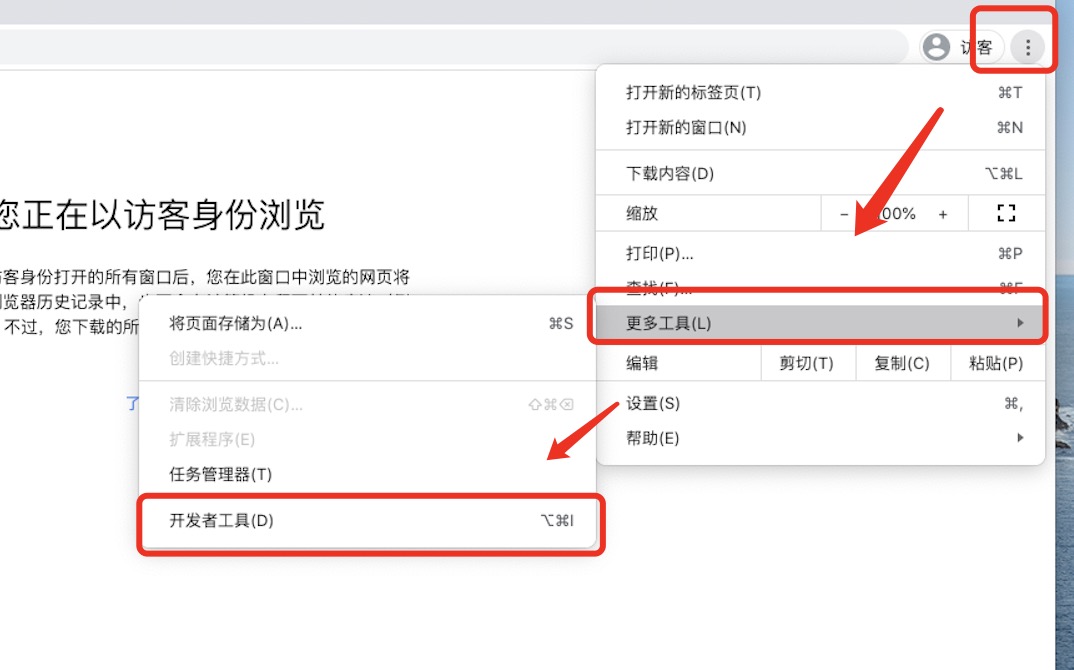
You can also select in the top-right menu bar"More Tools" => "Developer Tools"to open:
1. Debugging JavaScript Code in the Console Window
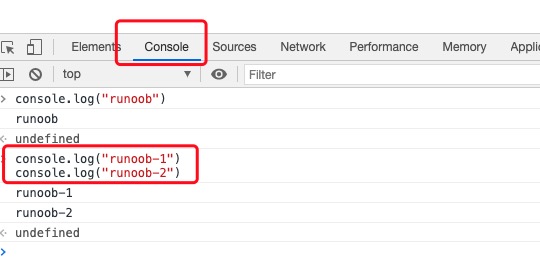
After opening the developer tools, we can debug JavaScript code in the Console window, as shown below:
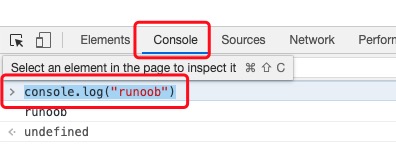
In the figure above, we>enter the code we want to execute after the symbolconsole.log("example"), and press Enter to execute.
We can also copy a piece of code from elsewhere to execute, for example, copy the following code to the Console window and press Enter to execute:
console.log("example-1")
console.log("example-2")
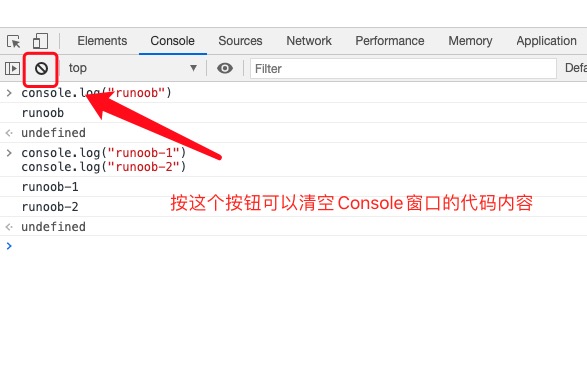
To clear the content of the Console window, you can press the following button:
2. Chrome Snippets Small Scripts
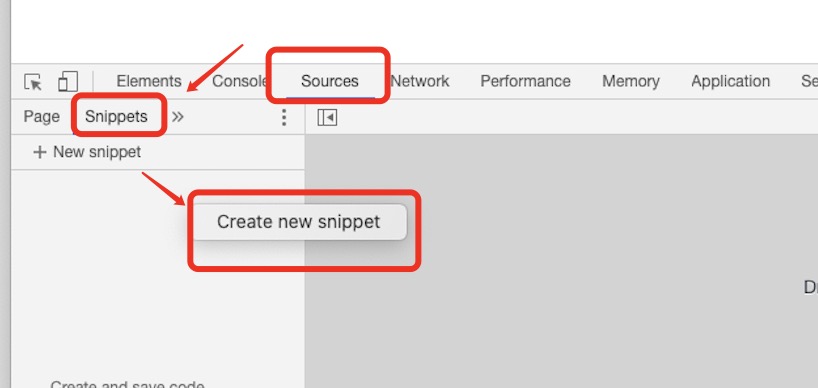
We can also create a script in the Chrome browser to execute. In the developer tools, click the Sources panel, select the Snippets tab, right-click in the navigator, and then select Create new snippet to create a new script file:
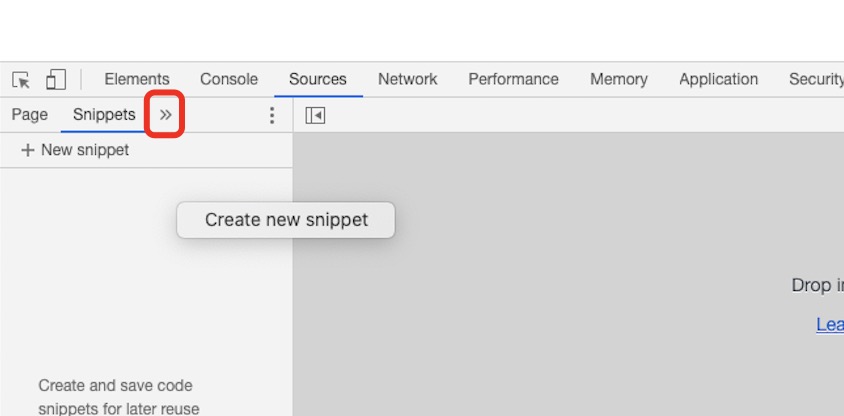
If you don't see Snippets, you can click the button on the panel below>>and then you will see it.
After clicking Create new snippet, a file will be automatically created. You only need to enter the following code in the right window, then press Command+S (Mac) or Ctrl+S (Windows and Linux) to save the changes.
console.log("example-1")
console.log("example-2")
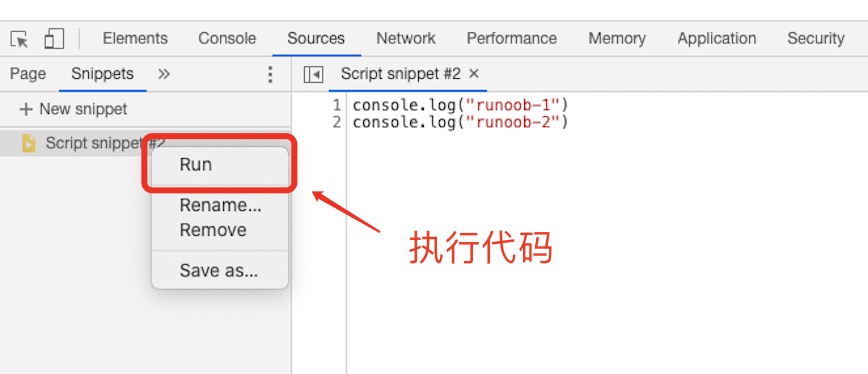
After saving, right-click the file name and select "Run" to execute the code: