JavaScript Debugging
When writing JavaScript, it can be painful if there are no debugging tools.
JavaScript Debugging
Without debugging tools, it is difficult to write JavaScript programs.
Your code may contain syntax errors and logical errors; without debugging tools, these errors are hard to find.
Usually, if JavaScript has errors, there are no prompts, so you cannot locate the position of the error in the code.

|
Often, errors occur while you are writing a new JavaScript code. |
|---|
JavaScript Debugging Tools
Finding errors in program code is called code debugging.
Debugging is hard, but fortunately, many browsers have built-in debugging tools.
Built-in debugging tools can be turned on or off, and severe error messages will be sent to the user.
With debugging tools, we can set breakpoints (positions where code stops executing), and detect variables while the code is executing.
To enable debugging tools in a browser, generally press the F12 key and select "Console" in the debug menu.
console.log() Method
If the browser supports debugging, you can use the console.log() method to print JavaScript values in the debug window:
Setting Breakpoints
In the debug window, you can set breakpoints in JavaScript code.
At each breakpoint, JavaScript code execution stops so that we can inspect the values of JavaScript variables.
After inspection, you can resume code execution (e.g., with the play button).
debugger Keyword
debuggerThe keyword is used to stop JavaScript execution and call the debugging function.
This keyword has the same effect as setting a breakpoint in the debugging tools.
If no debugging is available, the debugger statement will not work.
With debugger enabled, the code stops execution before the third line.
Debugging Tools in Major Browsers
Usually, to enable debugging tools in a browser, press the F12 key and select "Console" in the debug menu.
The steps for each browser are as follows:
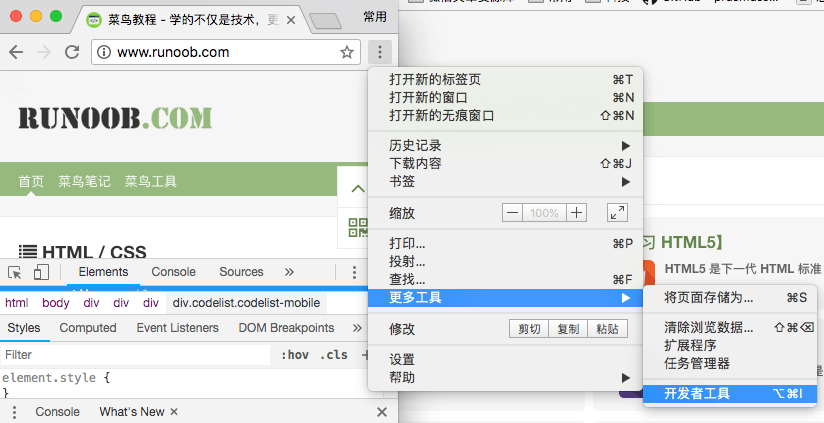
Chrome Browser
- Open the browser.
- In the menu, select"More tools"。
- In"More tools"then select"Developer tools"。
- Finally, select Console.
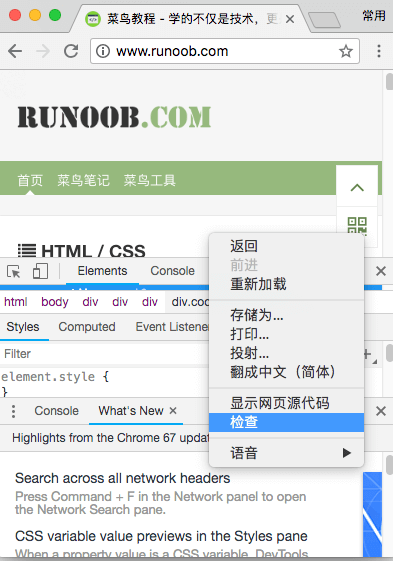
Or you can right-click and select"Inspect", as shown in the figure below:
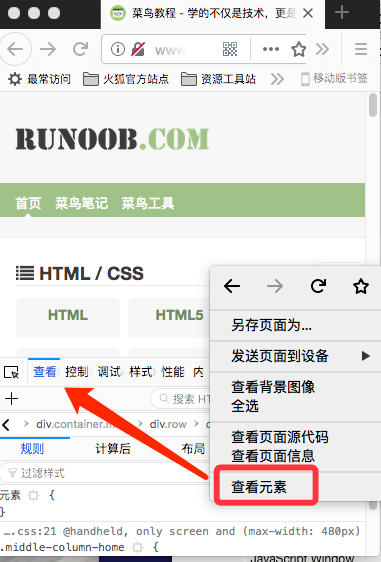
Firefox Browser
- Open the browser.
- Right-click and select"Inspect Element"。
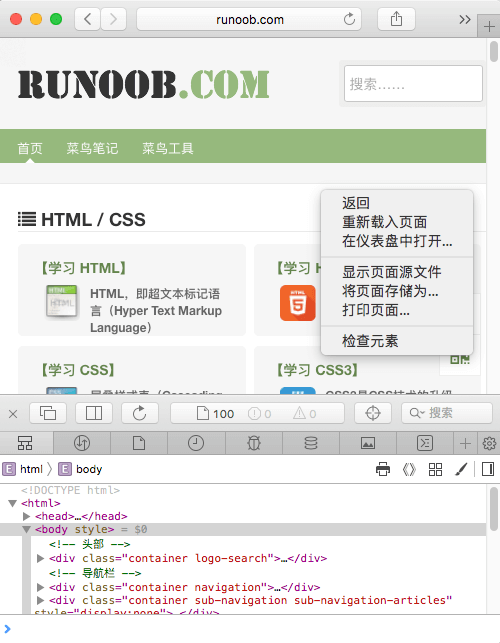
Safari
- Open the browser.
- Right-click and select Inspect Element.
- In the window that pops up at the bottom, select "Console".
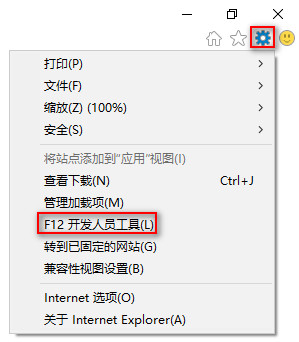
Internet Explorer Browser.
- Open the browser.
- In the menu, select Tools.
- In Tools, select Developer Tools.
- Finally, select Console.
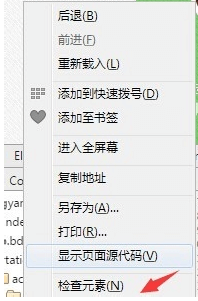
Opera
- Open the browser.
- Click the upper-left corner and select"Developer Tools", select"Web Inspector"。
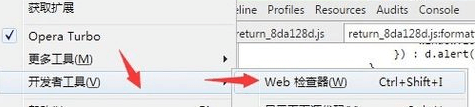
A simpler way is: right-click and select"Inspect Element"