iOS App Debugging
Introduction
When developing applications, we may make various mistakes, which can lead to various errors. Therefore, in order to fix these errors or bugs, we need to debug the application.
Choose a Debugger
The debuggers in Xcode are GDB and LLDB. GDB is the default. LLDB is a debugger that is part of the LLVM open-source compiler project. You can change the debugger by editing the active scheme options.
How to Find Coding Errors?
We just need to build our application. The code is compiled by the compiler, and all messages, errors, and warnings will be displayed along with the cause of the errors, which we can correct. You can click Product and then click "Analyze" to identify potential problems that may occur in the application.
Setting Breakpoints
Breakpoints help us understand the state of our application objects and help us find many defects, including different states of logic issues. We just need to click on the line number to create a breakpoint. We can delete a breakpoint by clicking and dragging it away. As shown below
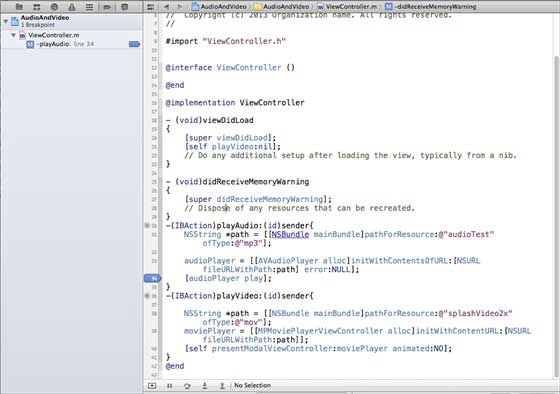
When we run the application and select the playVideo button, the application will be paused, and we can analyze the state of our application. When the breakpoint is triggered, we will get an output, as shown below
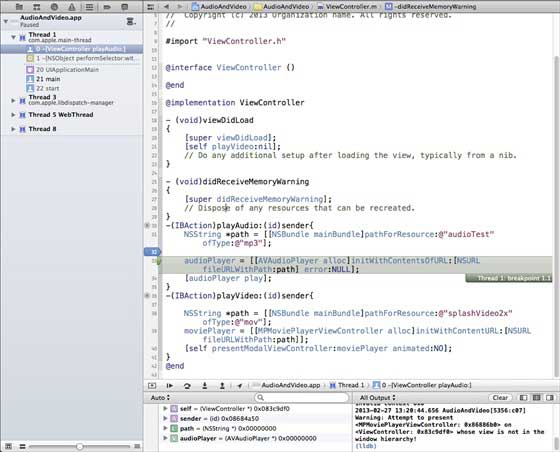
It is easy to determine which thread triggered the breakpoint. At the bottom, we can see objects such as self, sender, etc., which hold the values of the corresponding objects. We can expand some of these objects to see what the state of each one is.
To continue the application, we select the Continue button (the leftmost button) in the debug area, as shown below. Other options include Step and Step Over

Exception Breakpoints
We also have exception breakpoints, which trigger the application to stop at the location where an exception occurs. By selecting the Debug navigator and then the "+" button, we can create an exception breakpoint. You will get the following window
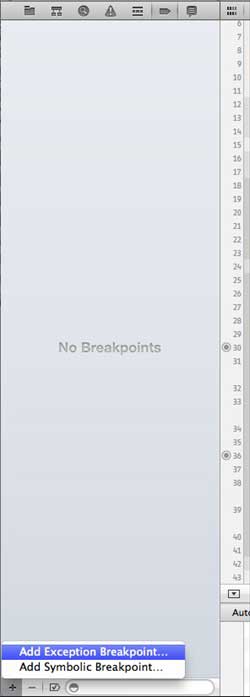
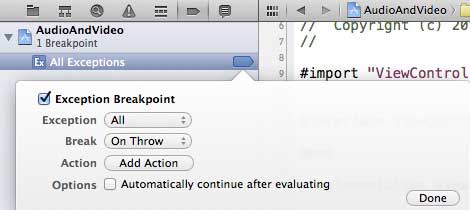
Then, we need to select the "Exception Breakpoint (Add Exception)" breakpoint, and it will display the following window
What's Next?
You can refer to theXcode 4 User Guideto learn more about debugging and other Xcode features.
Other Extensions