PyTorch Data Transformation
In PyTorch, data transformation is a mechanism for processing data when loading data, converting raw data into a format suitable for model training, mainly through tools provided by torchvision.transforms.
Data transformations can not only implement basic data preprocessing (such as normalization, resizing, etc.), but also help with data augmentation (such as random cropping, flipping, etc.), improving the model's generalization ability.
Why Are Data Transformations Needed?
Data Preprocessing:
- Adjust the data format, size, and range to make it suitable for model input.
- For example, images need to be resized to a fixed size, converted to tensor format, and normalized to [0,1].
Data Augmentation:
- Transform data during training to increase diversity.
- For example, increase the variety of data samples through random rotation, flipping, and cropping to avoid overfitting.
Flexibility:
- By defining a series of transformation operations, data can be processed dynamically, simplifying the complexity of data loading.
In PyTorch, the torchvision.transforms module provides a variety of transformation operations for image processing.
Basic Transformation Operations
| Transformation Function Name | Description | Example |
|---|---|---|
| transforms.ToTensor() | Converts a PIL image or NumPy array to a PyTorch tensor, and automatically normalizes pixel values to [0, 1]. | transform = transforms.ToTensor() |
| transforms.Normalize(mean, std) | Normalizes the image so that the data has zero mean and unit variance. | transform = transforms.Normalize(mean=[0.485, 0.456, 0.406], std=[0.229, 0.224, 0.225]) |
| transforms.Resize(size) | Resizes the image to ensure consistent image size for network input. | transform = transforms.Resize((256, 256)) |
| transforms.CenterCrop(size) | Crops a region of specified size from the center of the image. | transform = transforms.CenterCrop(224) |
1、ToTensor
Converts a PIL image or NumPy array to a PyTorch tensor.
Also normalizes pixel values from [0, 255] to [0, 1].
from torchvision import transforms

transform = transforms.ToTensor()
2、Normalize
Normalizes the data to have specific mean and standard deviation.
Commonly used for image data, normalizing its pixel values to have zero mean and unit variance.
transform = transforms.Normalize(mean=[0.5], std=[0.5]) # 归一化到 [-1, 1]
3、Resize
Resizes the image.
transform = transforms.Resize((128, 128)) # 将图像调整为 128x128
4、CenterCrop
Crops a region of specified size from the center of the image.
transform = transforms.CenterCrop(128) # 裁剪 128x128 的区域
Data Augmentation Operations
| Transformation Function Name | Description | Example |
|---|---|---|
| transforms.RandomHorizontalFlip(p) | Randomly flips the image horizontally. | transform = transforms.RandomHorizontalFlip(p=0.5) |
| transforms.RandomRotation(degrees) | Randomly rotates the image. | transform = transforms.RandomRotation(degrees=45) |
| transforms.ColorJitter(brightness, contrast, saturation, hue) | Adjusts the brightness, contrast, saturation, and hue of the image. | transform = transforms.ColorJitter(brightness=0.2, contrast=0.2, saturation=0.2, hue=0.1) |
| transforms.RandomCrop(size) | Randomly crops a region of specified size. | transform = transforms.RandomCrop(224) |
| transforms.RandomResizedCrop(size) | Randomly crops the image and resizes it to the specified size. | transform = transforms.RandomResizedCrop(224) |
1、RandomCrop
Randomly crops a specified size from the image.
transform = transforms.RandomCrop(128)
2、RandomHorizontalFlip
Flips the image horizontally with a certain probability.
transform = transforms.RandomHorizontalFlip(p=0.5) # 50% 概率翻转
3、RandomRotation
Rotates by a random angle.
transform = transforms.RandomRotation(degrees=30) # 随机旋转 -30 到 +30 度
4、ColorJitter
Randomly changes the brightness, contrast, saturation, or hue of the image.
transform = transforms.ColorJitter(brightness=0.5, contrast=0.5)
Composing Transformations
| Transformation Function Name | Description | Example |
|---|---|---|
| transforms.Compose() | Combines multiple transformations together and applies them sequentially in order. | transform = transforms.Compose([transforms.ToTensor(), transforms.Normalize(mean=[0.485, 0.456, 0.406], std=[0.229, 0.224, 0.225]), transforms.Resize((256, 256))]) |
Combine multiple transformations using transforms.Compose.
transform = transforms.Compose([
    transforms.Resize((128, 128)),
    transforms.RandomHorizontalFlip(p=0.5),
    transforms.ToTensor(),
    transforms.Normalize(mean=[0.5], std=[0.5])
])
Custom Transformations
If the functionality provided by transforms cannot meet the requirements, it can be implemented through custom classes or functions.
Example
def __call__(self, x):
# Any transformation logic can be customized here
return x * 2
transform = CustomTransform()
Example
Applying Transformations to Image Datasets
Load the MNIST dataset and apply transformations.
Example
from torch.utils.data import DataLoader
# Define transformations
transform = transforms.Compose([
transforms.Resize((128, 128)),
transforms.ToTensor(),
transforms.Normalize(mean=[0.5], std=[0.5])
])
# Load the dataset
train_dataset = datasets.MNIST(root='./data', train=True, transform=transform, download=True)
# Use DataLoader
train_loader = DataLoader(dataset=train_dataset, batch_size=32, shuffle=True)
# View the transformed data
for images, labels in train_loader:
print("Image tensor size:", images.size()) # [batch_size, 1, 128, 128]
break
The output result is:
图像张量大小: torch.Size([32, 1, 128, 128])
Visualizing Transformation Effects
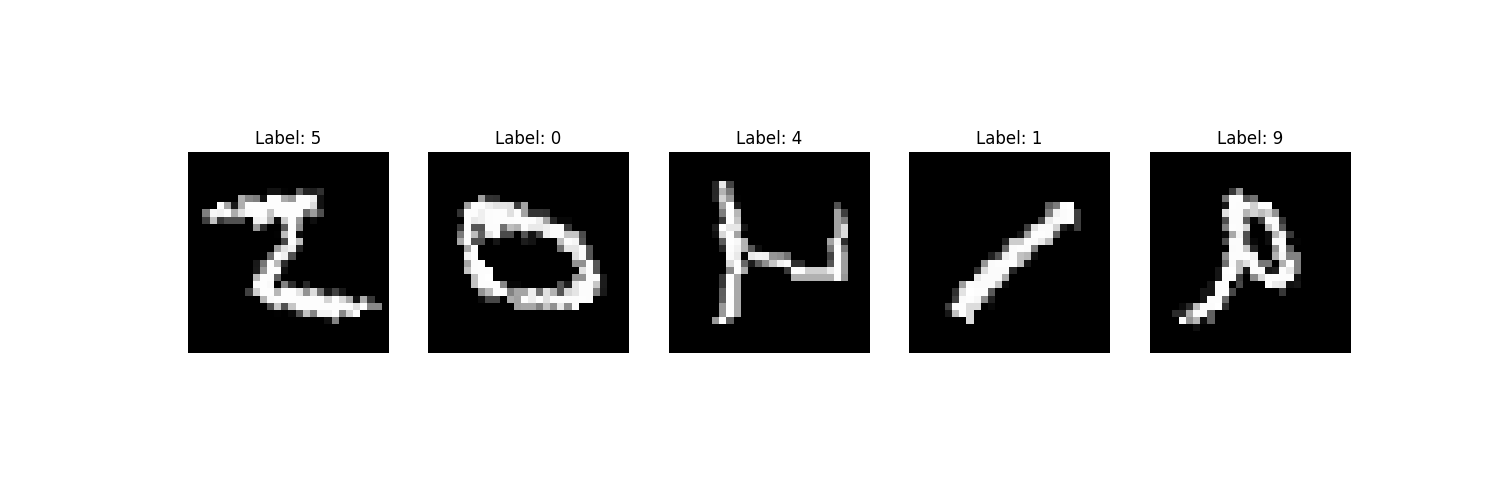
The following code shows a comparison between the original data and the transformed data.
Example
from torchvision import datasets
from torchvision import datasets, transforms
# Visualization of original and augmented images
transform_augment = transforms.Compose([
transforms.RandomHorizontalFlip(),
transforms.RandomRotation(30),
transforms.ToTensor()
])
# Load the dataset
dataset = datasets.MNIST(root='./data', train=True, download=True, transform=transform_augment)
# Display images
def show_images(dataset):
fig, axs = plt.subplots(1, 5, figsize=(15, 5))
for i in range(5):
image, label = dataset[i]
axs[i].imshow(image.squeeze(0), cmap='gray') # Convert (1, H, W) to (H, W)
axs[i].set_title(f"Label: {label}")
axs[i].axis('off')
plt.show()
show_images(dataset)
The display is as follows: