Matplotlib Multiple Plots
We can use the following in pyplotsubplot()andsubplots()methods to draw multiple subplots.
subplot()The method requires specifying a position when plotting,subplots()The method can generate multiple at once; when calling, you only need to call the 'ax' of the generated object.
subplot
subplot(nrows, ncols, index, **kwargs)
subplot(pos, **kwargs)
subplot(**kwargs)
subplot(ax)
The above functions divide the entire plotting area into nrows rows and ncols columns, then number each sub-area from left to right and top to bottom.1...NThe top-left sub-area is numbered 1, the bottom-right area is numbered N, and the numbering can be set through theindexparameter.
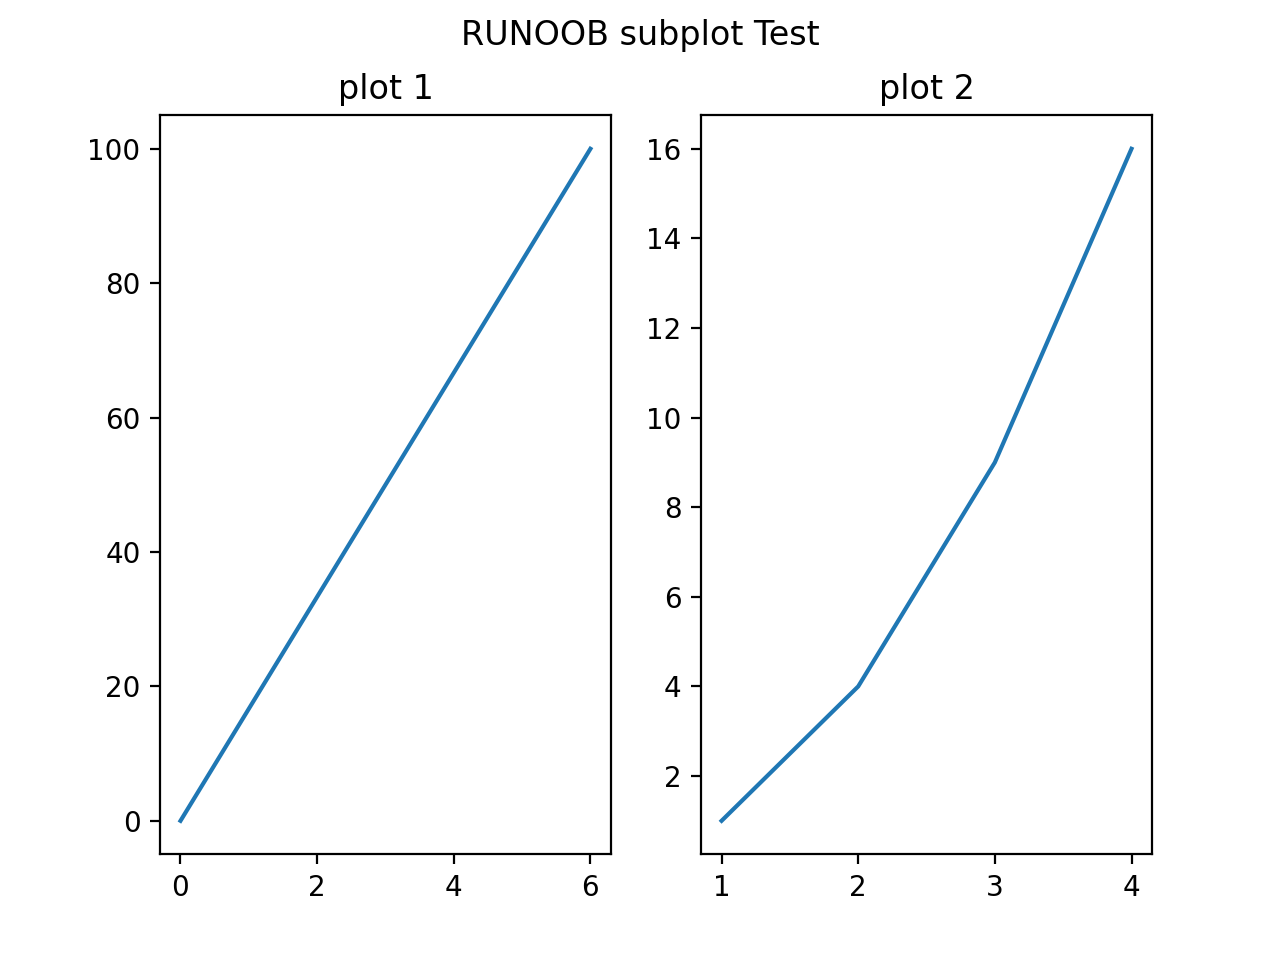
Set numRows = 1, numCols = 2, that is, draw the chart as a 1x2 image area, the corresponding coordinates are:
(1, 1), (1, 2)
plotNum = 1, representing the coordinate (1, 1), that is, the subplot in the first row and first column.
plotNum = 2, representing the coordinate (1, 2), that is, the subplot in the first row and second column.
Example
import numpy as np
#plot 1:
xpoints = np.array([0, 6])
ypoints = np.array([0, 100])
plt.subplot(1, 2, 1)
plt.plot(xpoints,ypoints)
plt.title("plot 1")
#plot 2:
x = np.array([1, 2, 3, 4])
y = np.array([1, 4, 9, 16])
plt.subplot(1, 2, 2)
plt.plot(x,y)
plt.title("plot 2")
plt.suptitle("EXAMPLE subplot Test")
plt.show()
The displayed result is as follows:
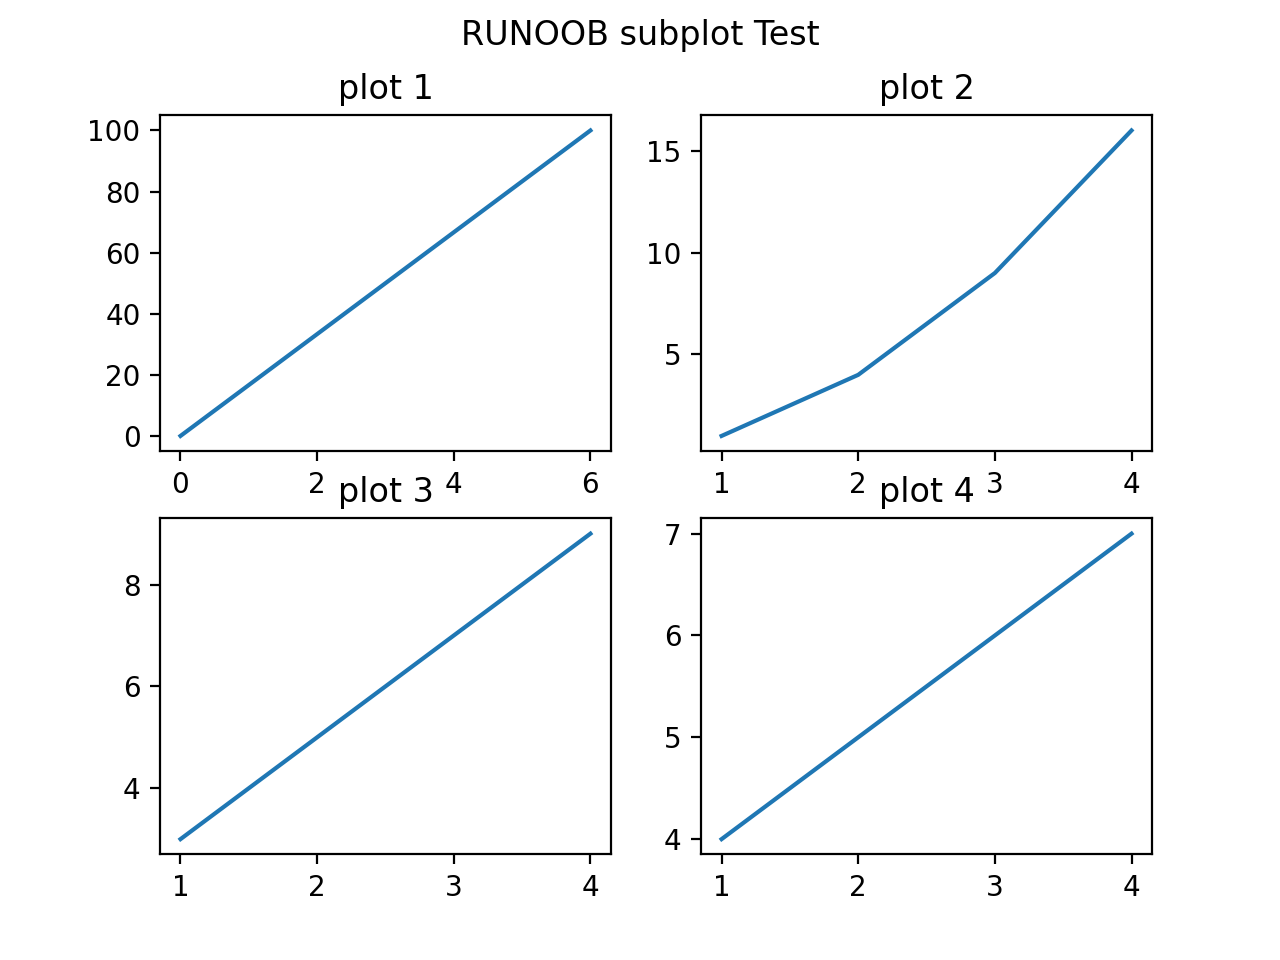
Set numRows = 2, numCols = 2, that is, draw the chart as a 2x2 image area, the corresponding coordinates are:
(1, 1), (1, 2)
(2, 1), (2, 2)
plotNum = 1, representing the coordinate (1, 1), that is, the subplot in the first row and first column.
plotNum = 2, representing the coordinate (1, 2), that is, the subplot in the first row and second column.
plotNum = 3, representing the coordinate (2, 1), that is, the subplot in the second row and first column.
plotNum = 4, representing the coordinate (2, 2), that is, the subplot in the second row and second column.
Example
import numpy as np
#plot 1:
x = np.array([0, 6])
y = np.array([0, 100])
plt.subplot(2, 2, 1)
plt.plot(x,y)
plt.title("plot 1")
#plot 2:
x = np.array([1, 2, 3, 4])
y = np.array([1, 4, 9, 16])
plt.subplot(2, 2, 2)
plt.plot(x,y)
plt.title("plot 2")
#plot 3:
x = np.array([1, 2, 3, 4])
y = np.array([3, 5, 7, 9])
plt.subplot(2, 2, 3)
plt.plot(x,y)
plt.title("plot 3")
#plot 4:
x = np.array([1, 2, 3, 4])
y = np.array([4, 5, 6, 7])
plt.subplot(2, 2, 4)
plt.plot(x,y)
plt.title("plot 4")
plt.suptitle("EXAMPLE subplot Test")
plt.show()
The displayed result is as follows:
subplots()
The syntax of the subplots() method is as follows:
matplotlib.pyplot.subplots(nrows=1, ncols=1, *, sharex=False, sharey=False, squeeze=True, subplot_kw=None, gridspec_kw=None, **fig_kw)Parameter description:
- nrows: default is 1, sets the number of rows of the chart.
- ncols: default is 1, sets the number of columns of the chart.
- sharex、sharey: sets whether the x and y axes share attributes, default is false, can be set to 'none', 'all', 'row', or 'col'. False or none means each subplot's x-axis or y-axis is independent; True or 'all' means all subplots share the x-axis or y-axis; 'row' sets each row of subplots to share an x-axis or y-axis; 'col' sets each column of subplots to share an x-axis or y-axis.
- squeeze: Boolean value, default is True, indicating that extra dimensions are squeezed out from the returned Axes object. For N*1 or 1*N subplots, a 1-dimensional array is returned; for N*M, N>1 and M>1, a 2-dimensional array is returned. If set to False, no squeezing is performed, and a 2-dimensional array of Axes instances is returned, even if it is ultimately 1x1.
- subplot_kw: Optional, dictionary type. Pass the dictionary's keywords to add_subplot() to create each subplot.
- gridspec_kw: Optional, dictionary type. Pass the dictionary's keywords to the GridSpec constructor to create subplots placed in a grid.
- **fig_kw: Pass detailed keyword arguments to the figure() function.
Example
import numpy as np
# Create some test data -- Figure 1
x = np.linspace(0, 2*np.pi, 400)
y = np.sin(x**2)
# Create a figure and subplot -- Figure 2
fig, ax = plt.subplots()
ax.plot(x, y)
ax.set_title('Simple plot')
# Create two subplots -- Figure 3
f, (ax1, ax2) = plt.subplots(1, 2, sharey=True)
ax1.plot(x, y)
ax1.set_title('Sharing Y axis')
ax2.scatter(x, y)
# Create four subplots -- Figure 4
fig, axs = plt.subplots(2, 2, subplot_kw=dict(projection="polar"))
axs[0, 0].plot(x, y)
axs[1, 1].scatter(x, y)
# Share x-axis
plt.subplots(2, 2, sharex='col')
# Share y-axis
plt.subplots(2, 2, sharey='row')
# Share x-axis and y-axis
plt.subplots(2, 2, sharex='all', sharey='all')
# This also shares x-axis and y-axis
plt.subplots(2, 2, sharex=True, sharey=True)
# Create a figure with identifier 10, delete it if it already exists
fig, ax = plt.subplots(num=10, clear=True)
plt.show()
Some of the chart display results are as follows:
Figure 1
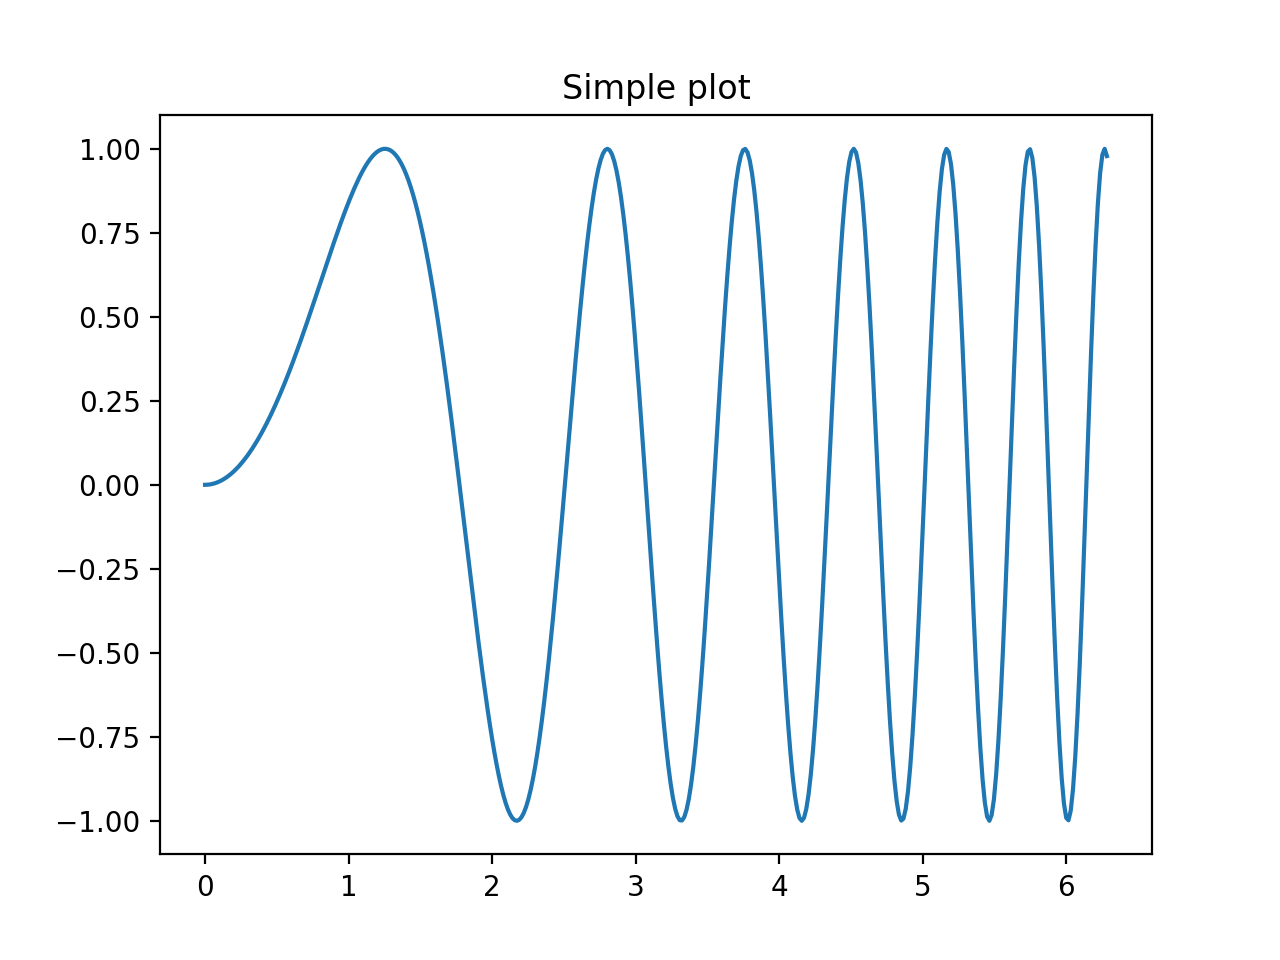
Figure 2
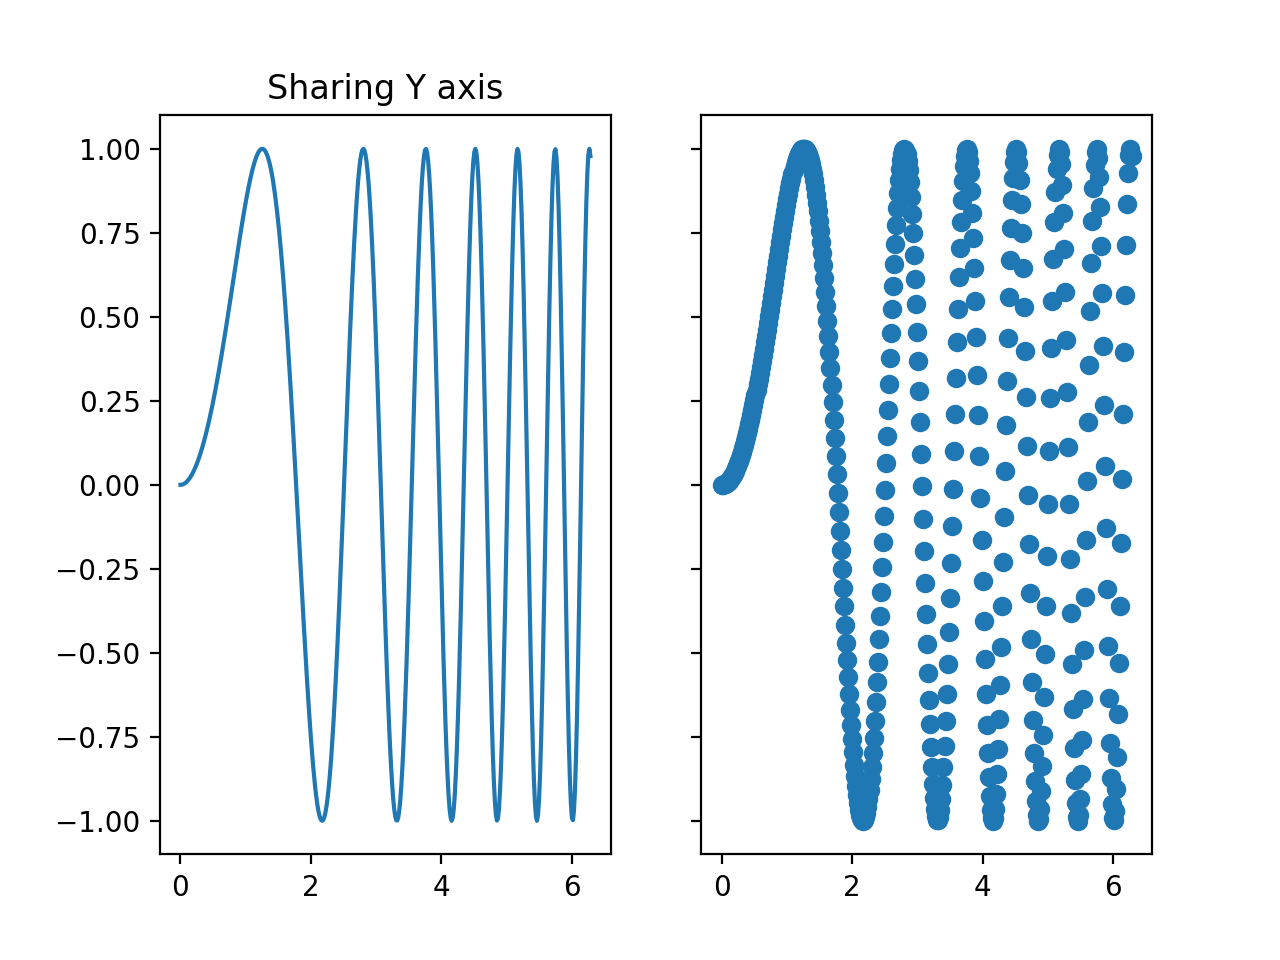
Figure 3
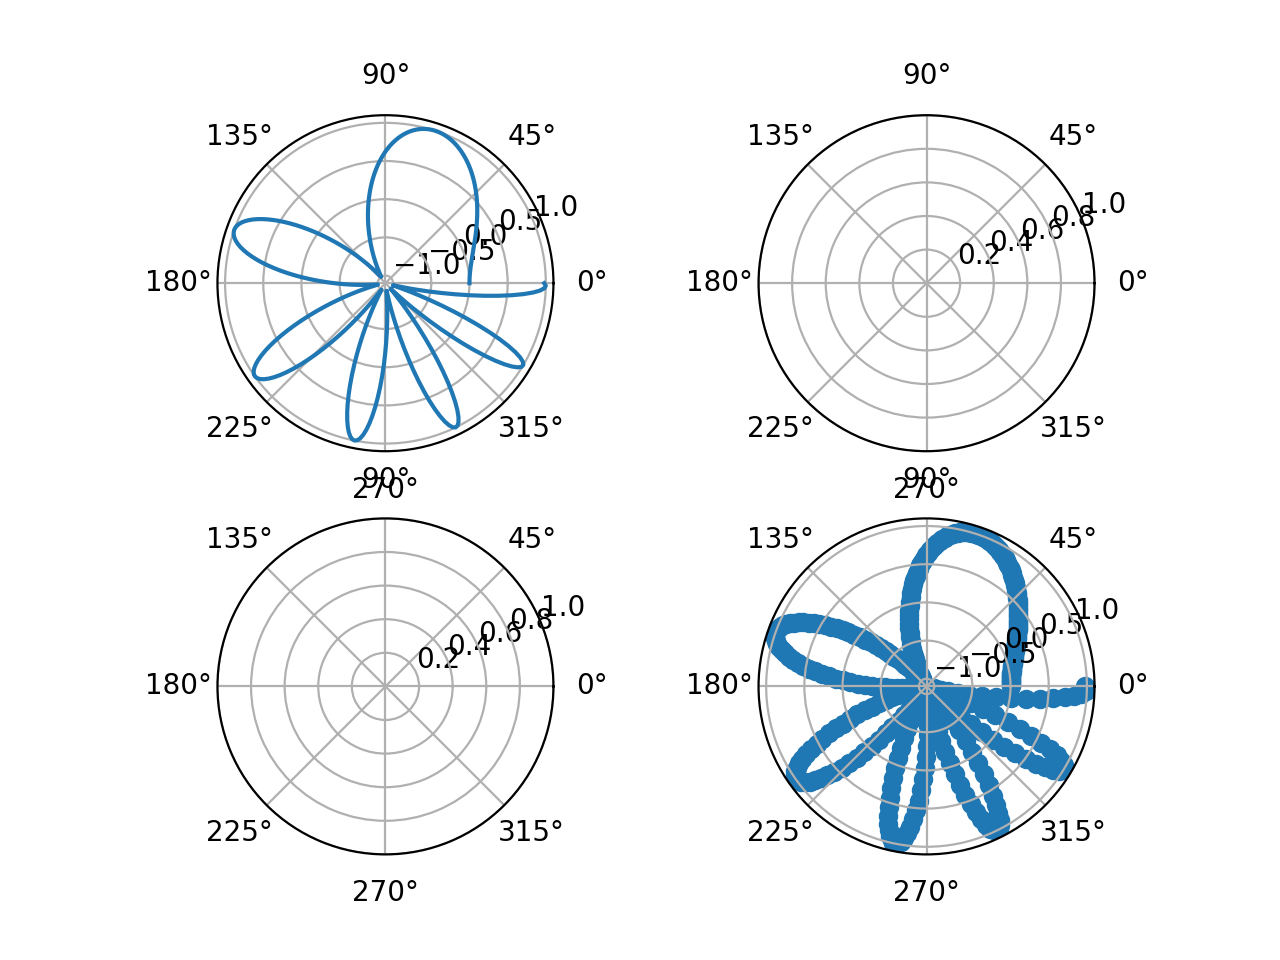
Figure 4