Matplotlib Plot Markers
In the plotting process, if we want to customize some different markers for the coordinates, we can useplot()the method'smarkerparameter to define.
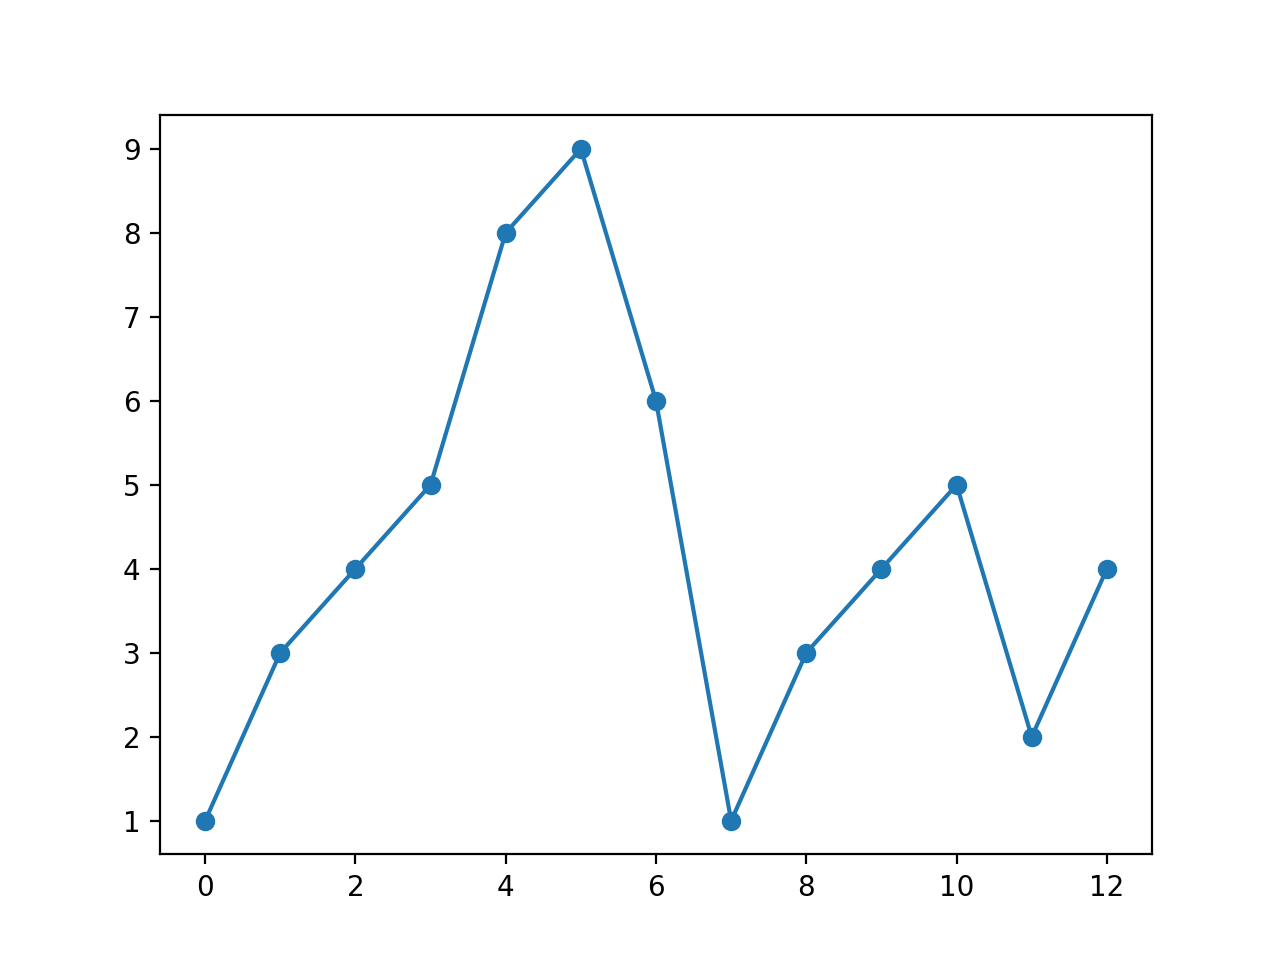
The following example defines a solid circle marker:
Example
import numpy as np
ypoints = np.array([1,3,4,5,8,9,6,1,3,4,5,2,4])
plt.plot(ypoints, marker = 'o')
plt.show()
The displayed result is as follows:
markerThe symbols that can be defined are as follows:
| Marker | Symbol | Description |
|---|---|---|
| "." |  |
Point |
| "," |  |
Pixel point |
| "o" |  |
Solid circle |
| "v" |  |
Down triangle |
| "^" |  |
Up triangle |
| "<" |  |
Left triangle |
| ">" |  |
Right triangle |
| "1" |  |
Down tri |
| "2" |  |
Up tri |
| "3" |  |
Left tri |
| "4" |  |
Right tri |
| "8" | Octagon | |
| "s" |  |
Square |
| "p" |  |
Pentagon |
| "P" |  |
Plus sign (filled) |
| "*" |  |
Star |
| "h" |  |
Hexagon 1 |
| "H" |  |
Hexagon 2 |
| "+" |  |
Plus |
| "x" |  |
Multiplication sign x |
| "X" |  |
Multiplication sign x (filled) |
| "D" |  |
Diamond |
| "d" |  |
Thin diamond |
| "|" |  |
Vertical line |
| "_" |  |
Horizontal line |
| 0 (TICKLEFT) |  |
Left horizontal line |
| 1 (TICKRIGHT) |  |
Right horizontal line |
| 2 (TICKUP) |  |
Up vertical line |
| 3 (TICKDOWN) | Down vertical line | |
| 4 (CARETLEFT) |  |
Left arrow |
| 5 (CARETRIGHT) |  |
Right arrow |
| 6 (CARETUP) |  |
Up arrow |
| 7 (CARETDOWN) |  |
Down arrow |
| 8 (CARETLEFTBASE) |  |
Left arrow (based on midpoint) |
| 9 (CARETRIGHTBASE) |  |
Right arrow (based on midpoint) |
| 10 (CARETUPBASE) |  |
Up arrow (based on midpoint) |
| 11 (CARETDOWNBASE) |  |
Down arrow (based on midpoint) |
| "None", " " or "" | No marker | |
| '$...$' |  |
Render the specified character. For example, "$f$" uses the letter f as the marker. |
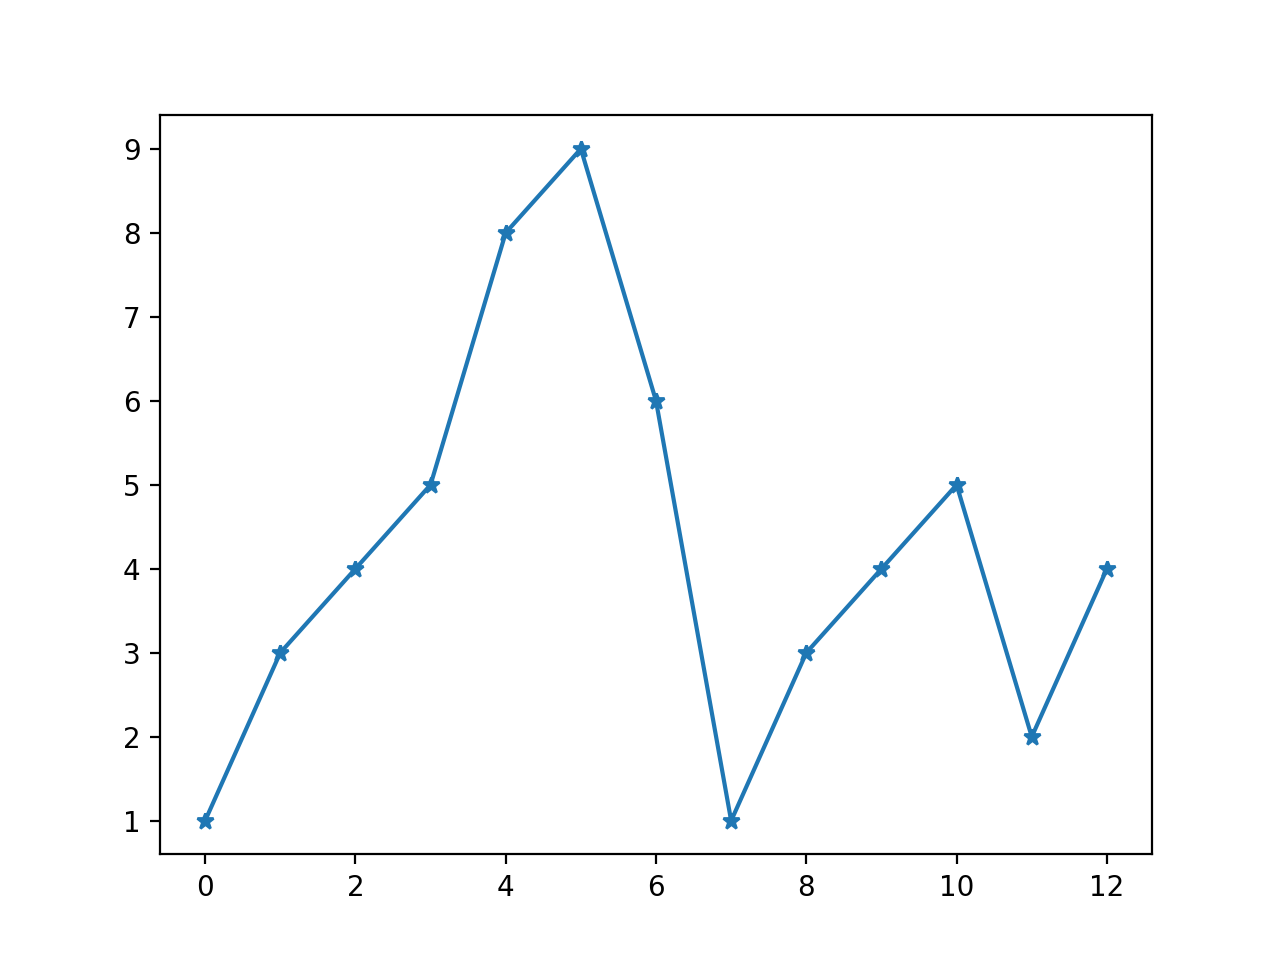
The following example defines*marker:
Example
import numpy as np
ypoints = np.array([1,3,4,5,8,9,6,1,3,4,5,2,4])
plt.plot(ypoints, marker = '*')
plt.show()
The displayed result is as follows:
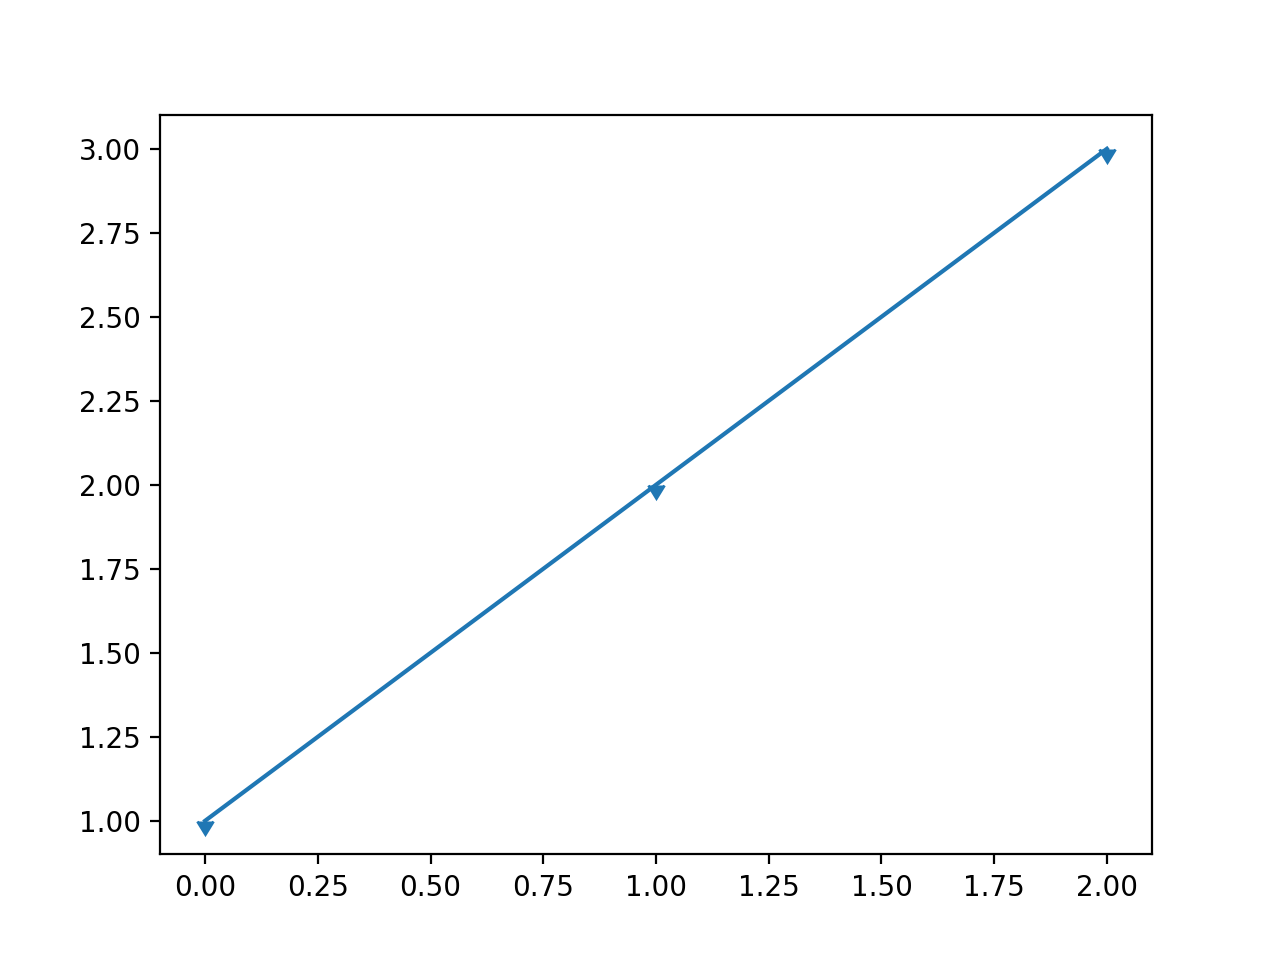
The following example defines a down arrow:
Example
import matplotlib.markers
plt.plot([1, 2, 3], marker=matplotlib.markers.CARETDOWNBASE)
plt.show()
The displayed result is as follows:
fmt parameter
The fmt parameter defines the basic format, such as marker, line style, and color.
fmt = '[marker][line][color]'
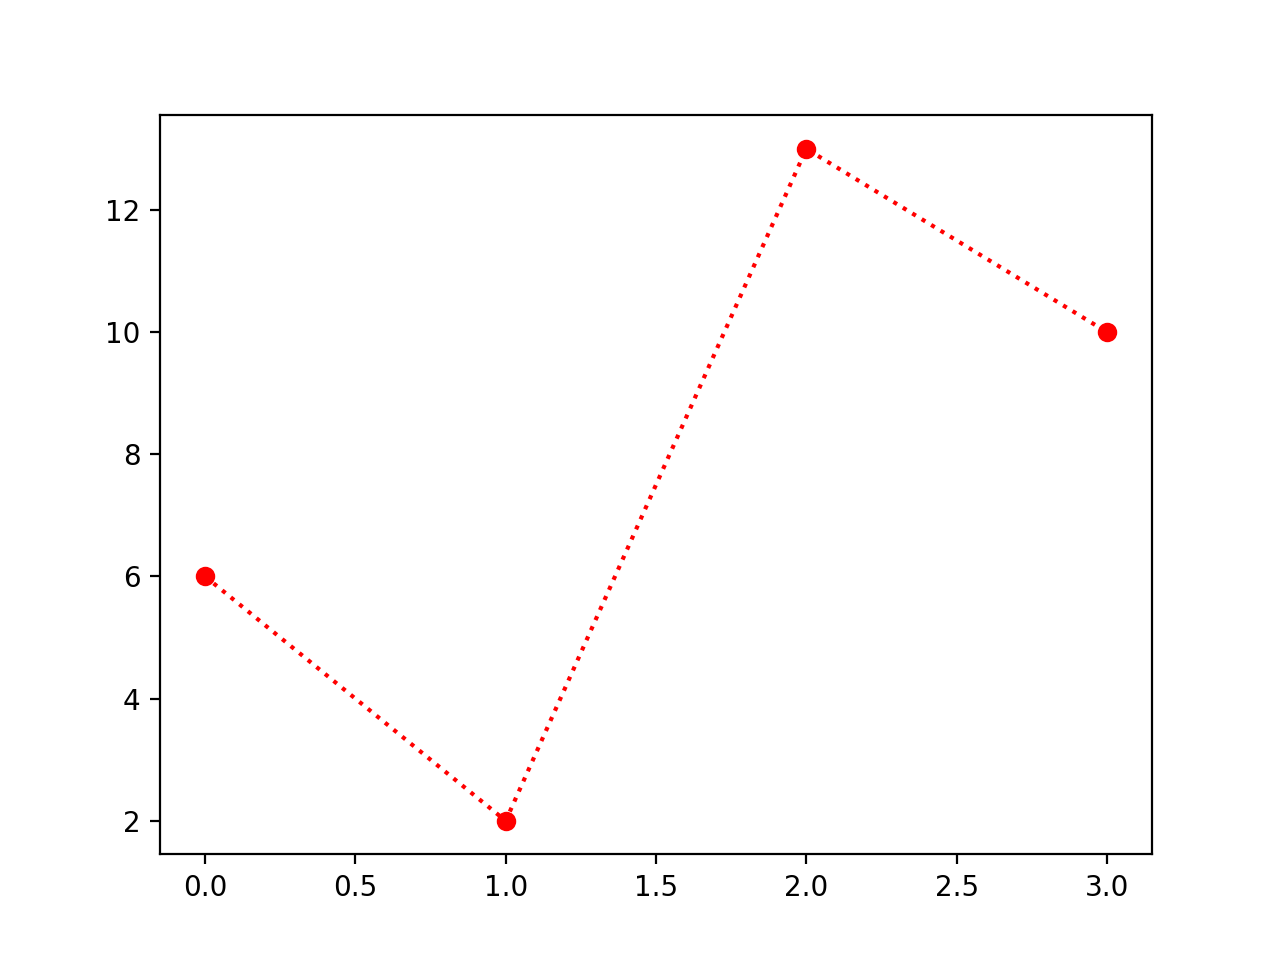
For exampleo:r,orepresents a solid circle marker,:represents a dashed line,rrepresents the color red.
Example
import numpy as np
ypoints = np.array([6, 2, 13, 10])
plt.plot(ypoints, 'o:r')
plt.show()
The displayed result is as follows:
Line types:
| Line type marker | Description | |
|---|---|---|
| '-' | Solid line | |
| ':' | Dashed line | |
| '--' | Broken line | |
| '-.' | Dash-dot line | |
Color types:
| Color marker | Description | |
|---|---|---|
| 'r' | Red | |
| 'g' | Green | |
| 'b' | Blue | |
| 'c' | Cyan | |
| 'm' | Magenta | |
| 'y' | Yellow | |
| 'k' | Black | |
| 'w' | White | |
Marker Size and Color
We can customize the size and color of the marker. The parameters used are:- markersize, abbreviated asms: defines the size of the marker.
- markerfacecolor, abbreviated asmfc: defines the color of the marker's interior.
- markeredgecolor, abbreviated asmec: defines the color of the marker's border.
Set the marker size:
Example
import numpy as np
ypoints = np.array([6, 2, 13, 10])
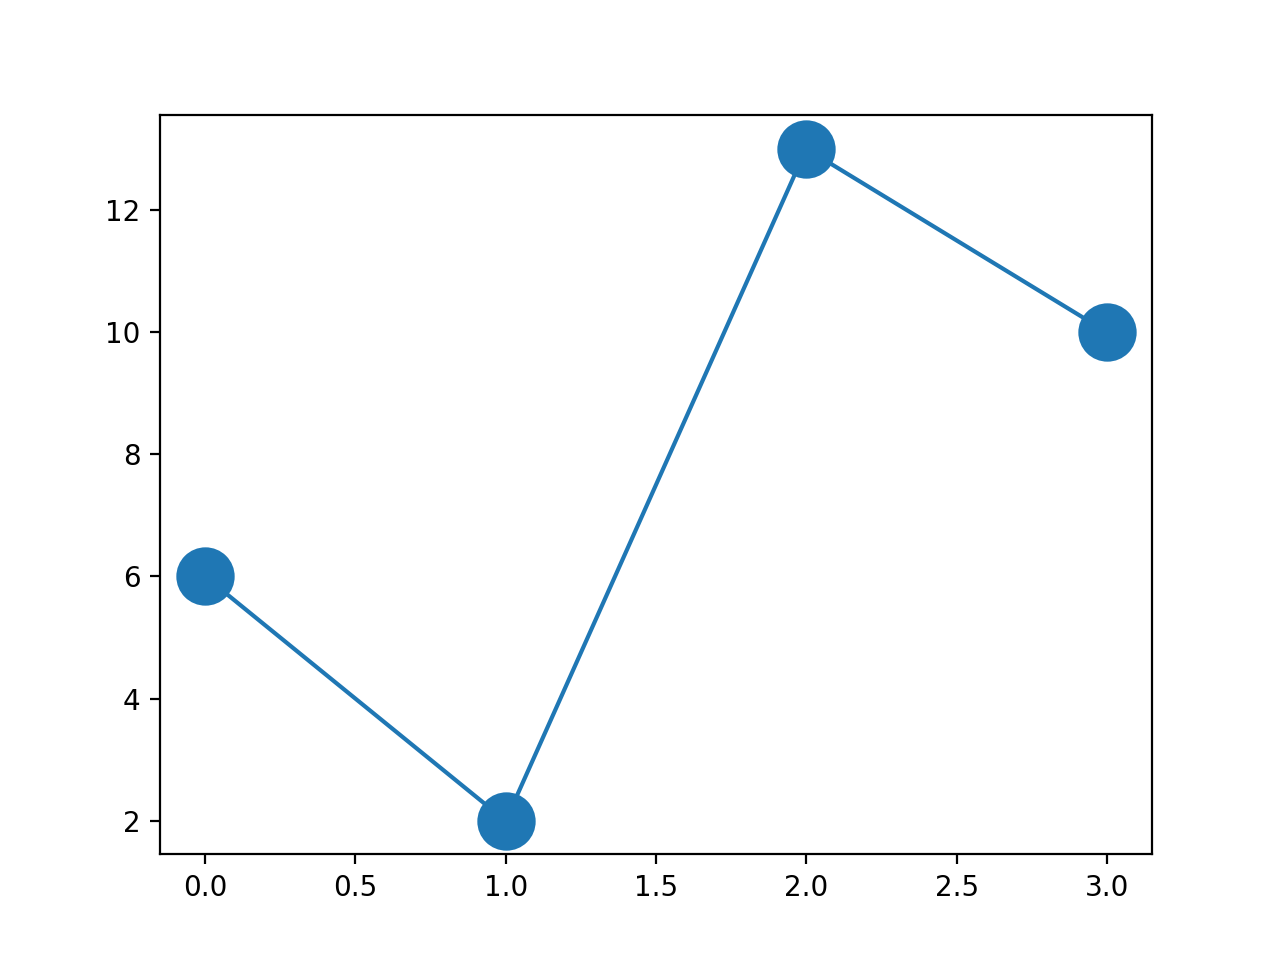
plt.plot(ypoints, marker = 'o', ms = 20)
plt.show()
The displayed result is as follows:
Set the marker border color:
Example
import numpy as np
ypoints = np.array([6, 2, 13, 10])
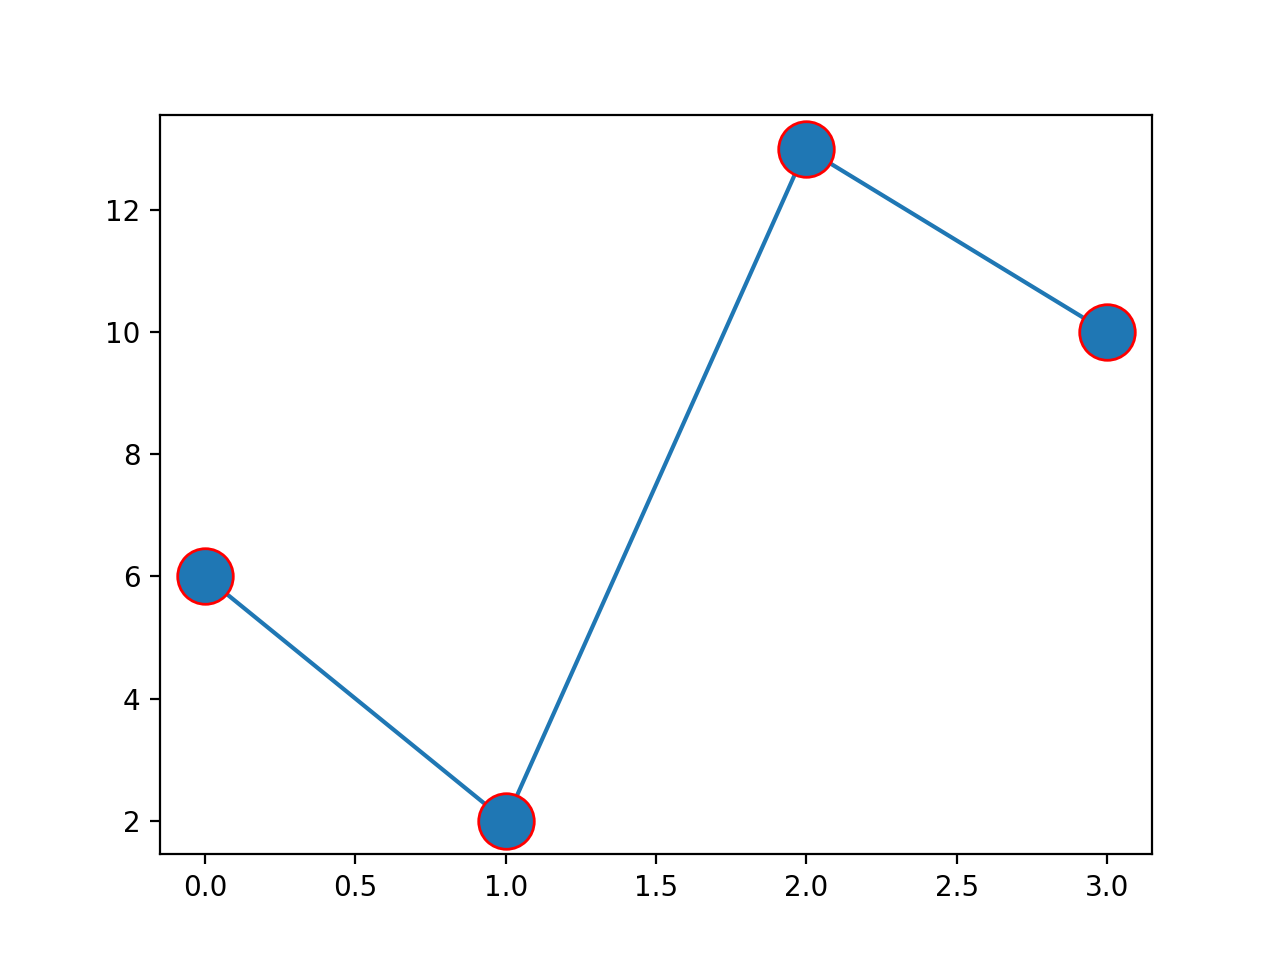
plt.plot(ypoints, marker = 'o', ms = 20, mec = 'r')
plt.show()
The displayed result is as follows:
Set the marker interior color:
Example
import numpy as np
ypoints = np.array([6, 2, 13, 10])
plt.plot(ypoints, marker = 'o', ms = 20, mfc = 'r')
plt.show()
The displayed result is as follows:
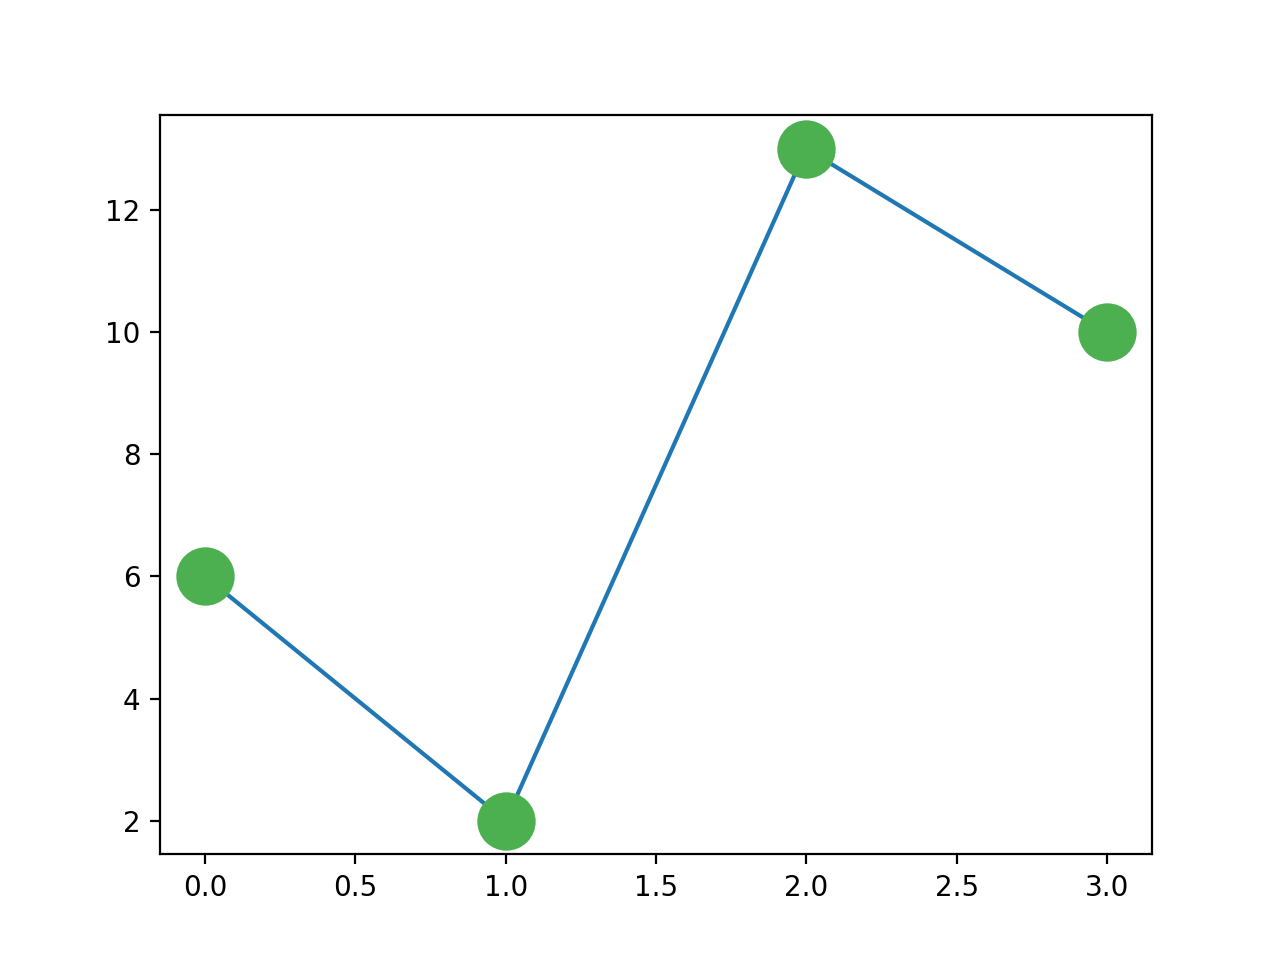
Customize the color of the marker's interior and border:
Example
import numpy as np
ypoints = np.array([6, 2, 13, 10])
plt.plot(ypoints, marker = 'o', ms = 20, mec = '#4C7EAF', mfc = '#4C7EAF')
plt.show()
The displayed result is as follows: