Matplotlib Pie Chart
A pie chart is a commonly used data visualization graph that shows the proportion of each category in the total.
In pyplot, we can use thepie()method to draw a pie chart.
The syntax of the pie() method is as follows:
matplotlib.pyplot.pie(x, explode=None, labels=None, colors=None, autopct=None, pctdistance=0.6, shadow=False, labeldistance=1.1, startangle=0, radius=1, counterclock=True, wedgeprops=None, textprops=None, center=0, 0, frame=False, rotatelabels=False, *, normalize=None, data=None)[source]
Parameter description:
-
x: A floating-point array or list, the data used to draw the pie chart, representing the area of each sector.
-
explode: An array, representing the gap between sectors, with a default value of 0.
-
labels: A list, labels for each sector, with a default value of None.
-
colors: An array, representing the colors of each sector, with a default value of None.
-
autopct: Set the percentage display format of each sector in the pie chart,%d%%integer percentage,%0.1fone decimal place,%0.1f%%one decimal place percentage,%0.2f%%two decimal places percentage.
-
labeldistance: The drawing position of the label annotations, as a ratio relative to the radius, with a default value of 1.1, such as<1then it is drawn inside the pie chart.
-
pctdistance:: Similar to labeldistance, specifies the position scale of autopct, with a default value of 0.6.
-
shadow:: Boolean value True or False, sets the shadow of the pie chart. Default is False, i.e., no shadow.
-
radius:: Sets the radius of the pie chart, default is 1.
-
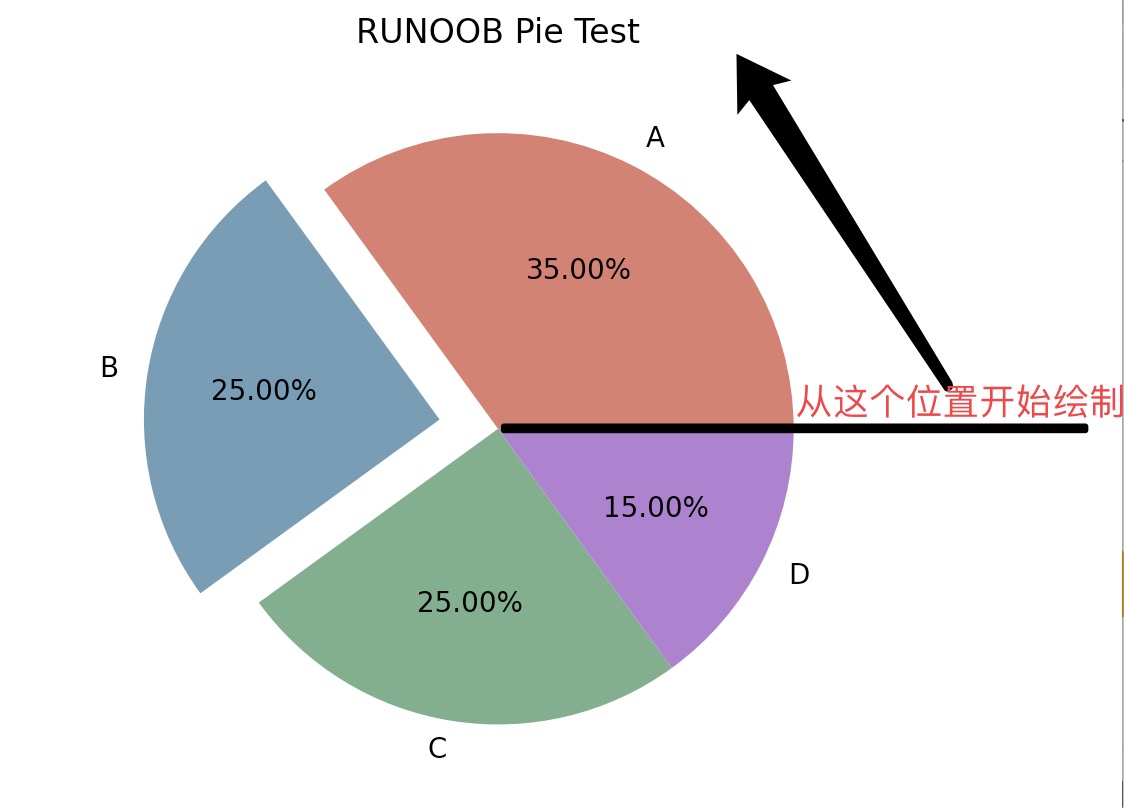
startangle:: Used to specify the starting angle of the pie chart. By default, it draws counterclockwise from the positive x-axis; if set to 90, it draws from the positive y-axis.
-
counterclock: Boolean value, used to specify whether to draw sectors counterclockwise. Default is True, i.e., counterclockwise; False is clockwise.
- wedgeprops: Dictionary type, default is None. Used to specify sector properties, such as border line color, border line width, etc. For example: wedgeprops={'linewidth':5} sets the wedge line width to 5.
- textprops: Dictionary type, used to specify text label properties, such as font size, font color, etc. Default is None.
- center: List of float type, used to specify the center position of the pie chart. Default: (0,0).
- frame: Boolean type, used to specify whether to draw the frame of the pie chart. Default: False. If True, draw the axes frame with the chart.
- rotatelabels: Boolean type, used to specify whether to rotate text labels. Default is False. If True, rotate each label to the specified angle.
-
data: Used to specify data. If the data parameter is set, you can directly use columns in the DataFrame as values for parameters such as x and labels without passing them again.
In addition, the pie() function can also return three parameters:
wedges: A list containing the wedge objects.texts: A list containing text label objects.autotexts: A list containing automatically generated text label objects.
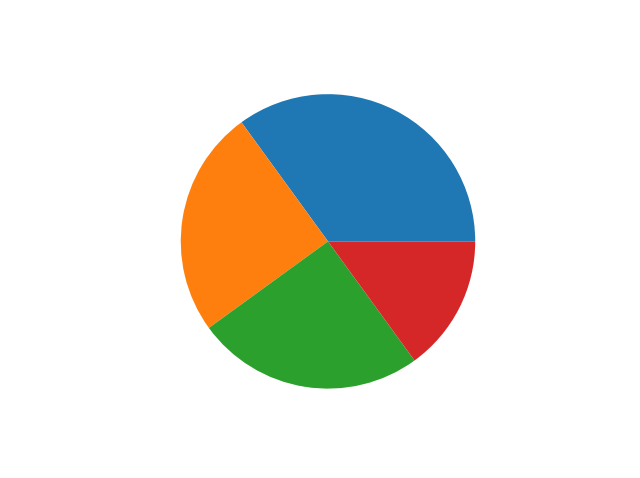
The following example simply uses pie() to create a pie chart:
Example
import numpy as np
y = np.array([35, 25, 25, 15])
plt.pie(y)
plt.show()
The displayed result is as follows:
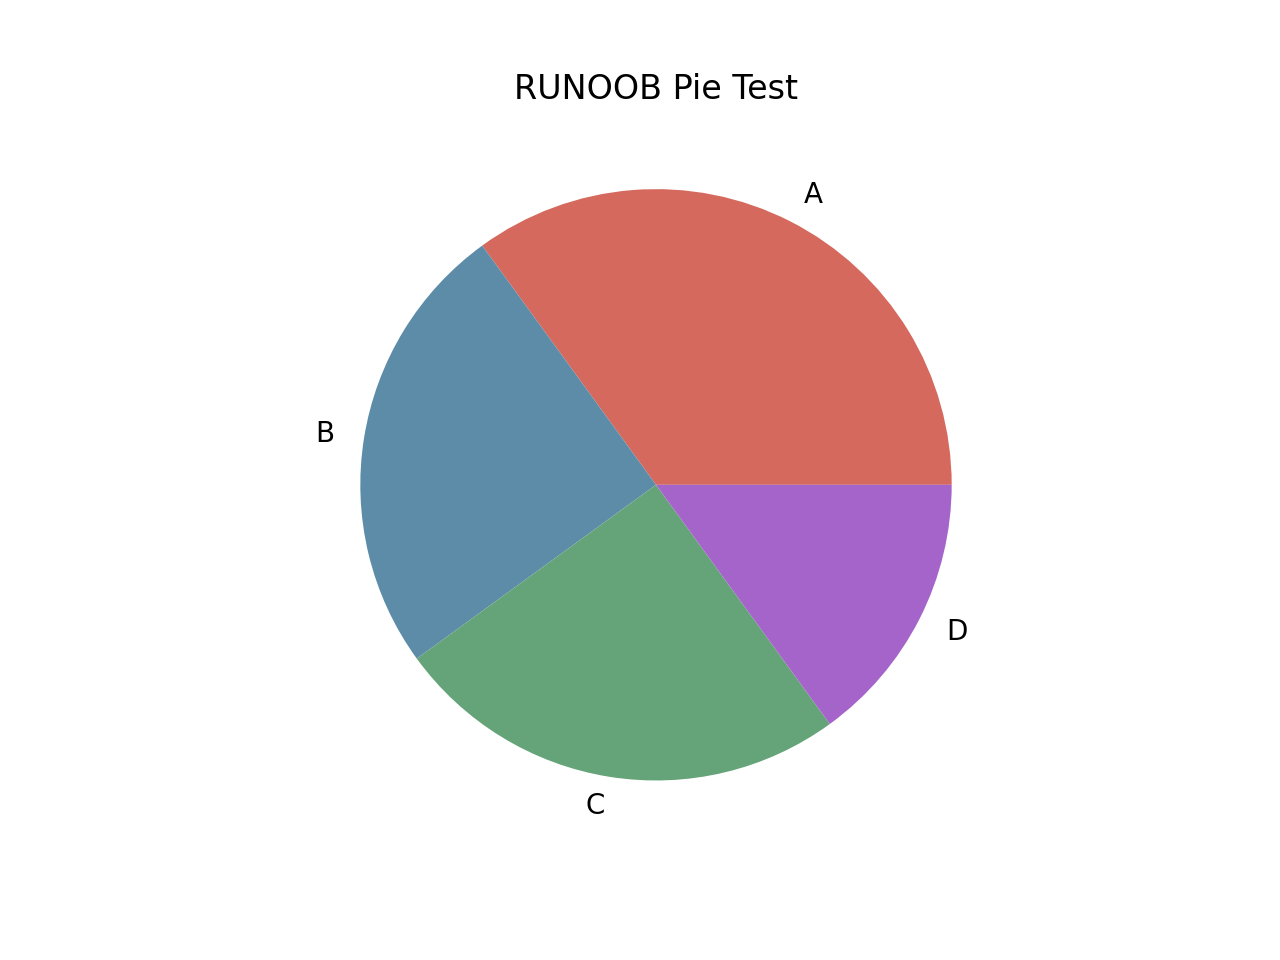
Set the labels and colors of each sector of the pie chart:
Example
import numpy as np
y = np.array([35, 25, 25, 15])
plt.pie(y,
labels=['A','B','C','D'], # Set pie chart labels
colors=["#d5695d", "#5d8ca8", "#5B80A6", "#a564c9"], # Set pie chart colors
)
plt.title("EXAMPLE Pie Test") # Set title
plt.show()
The displayed result is as follows:
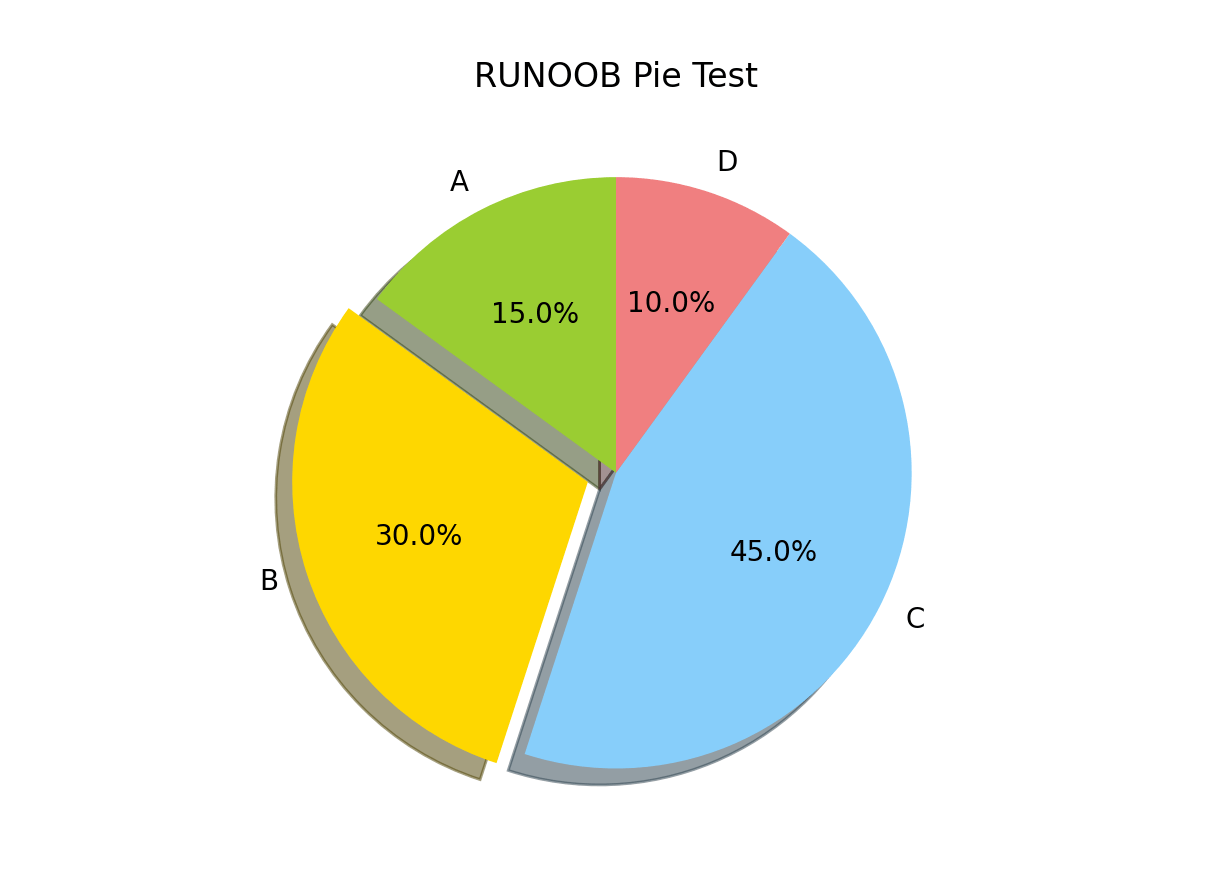
Highlight the second sector and format the output percentage:
Example
# Data
sizes = [15, 30, 45, 10]
# Pie chart labels
labels = ['A', 'B', 'C', 'D']
# Pie chart colors
colors = ['yellowgreen', 'gold', 'lightskyblue', 'lightcoral']
# Highlight the second sector
explode = (0, 0.1, 0, 0)
# Draw the pie chart
plt.pie(sizes, explode=explode, labels=labels, colors=colors,
autopct='%1.1f%%', shadow=True, startangle=90)
# Title
plt.title("EXAMPLE Pie Test")
# Display the plot
plt.show()
We defined a list sizes containing 4 elements, which represents the proportion of each category in the total. Then, we defined a list labels containing 4 elements, which represents the labels of each category. Next, we defined a list colors containing 4 elements, which represents the color of each category. Then, we defined a tuple explode containing 4 elements, which is used to specify whether to highlight a sector. Next, we called the plt.pie function to draw the pie chart, passing in the above parameters. Finally, we added a title and called plt.show() to display the plot.
The displayed result is as follows:
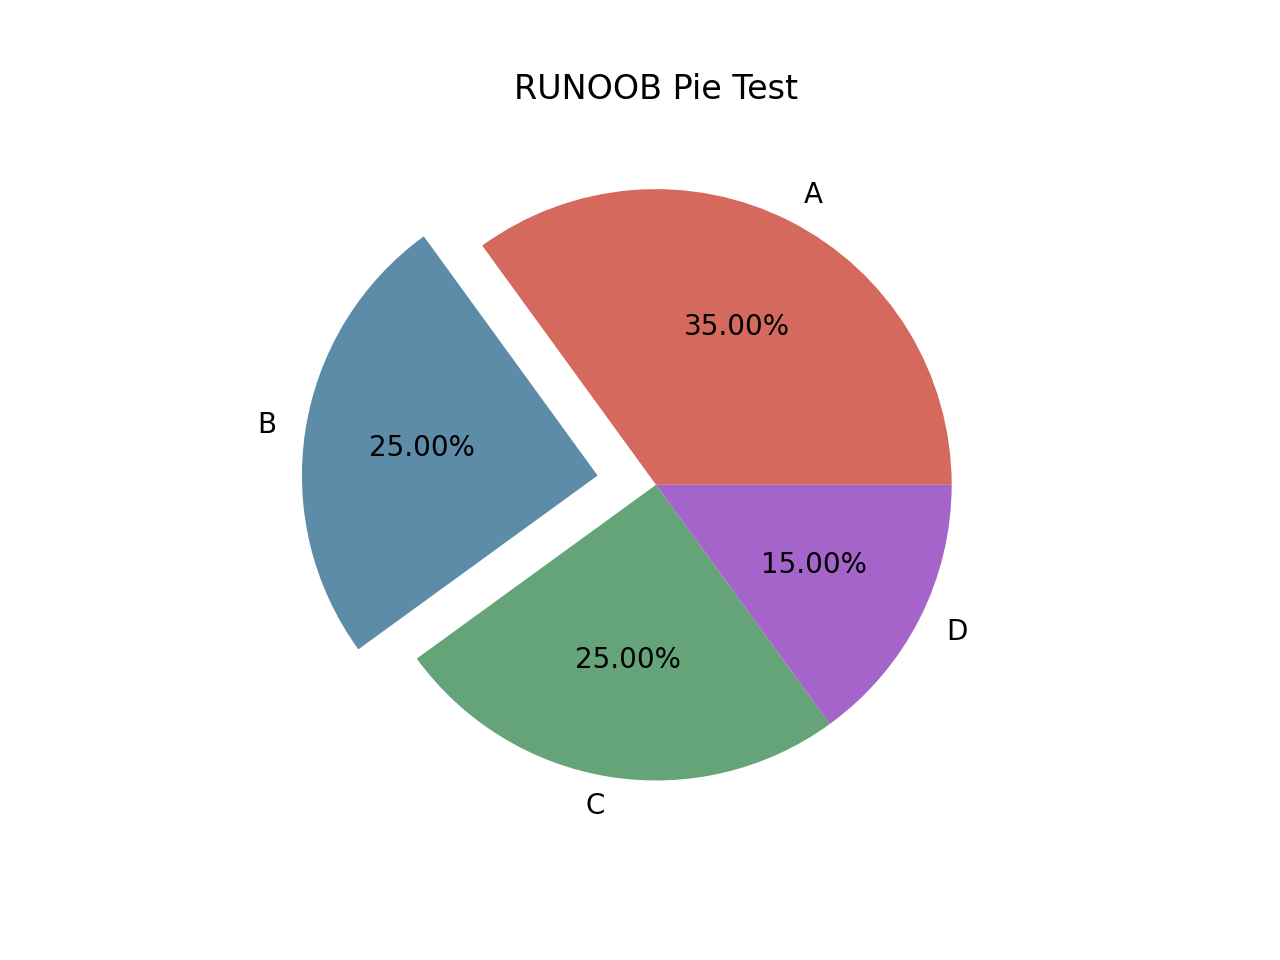
Example
import numpy as np
y = np.array([35, 25, 25, 15])
plt.pie(y,
labels=['A','B','C','D'], # Set pie chart labels
colors=["#d5695d", "#5d8ca8", "#5B80A6", "#a564c9"], # Set pie chart colors
explode=(0, 0.2, 0, 0), # The second part is highlighted; the larger the value, the farther from the center
autopct='%.2f%%', # Format the output percentage
)
plt.title("EXAMPLE Pie Test")
plt.show()
Other extensionsNote:By default, the first sector is drawn from the x-axis and moves counterclockwise: