Matplotlib Axis Labels and Title
We can usexlabel()andylabel()method to set labels for x-axis and y-axis.
Example
import matplotlib.pyplot as plt
x = np.array([1, 2, 3, 4])
y = np.array([1, 4, 9, 16])
plt.plot(x, y)
plt.xlabel("x - label")
plt.ylabel("y - label")
plt.show()
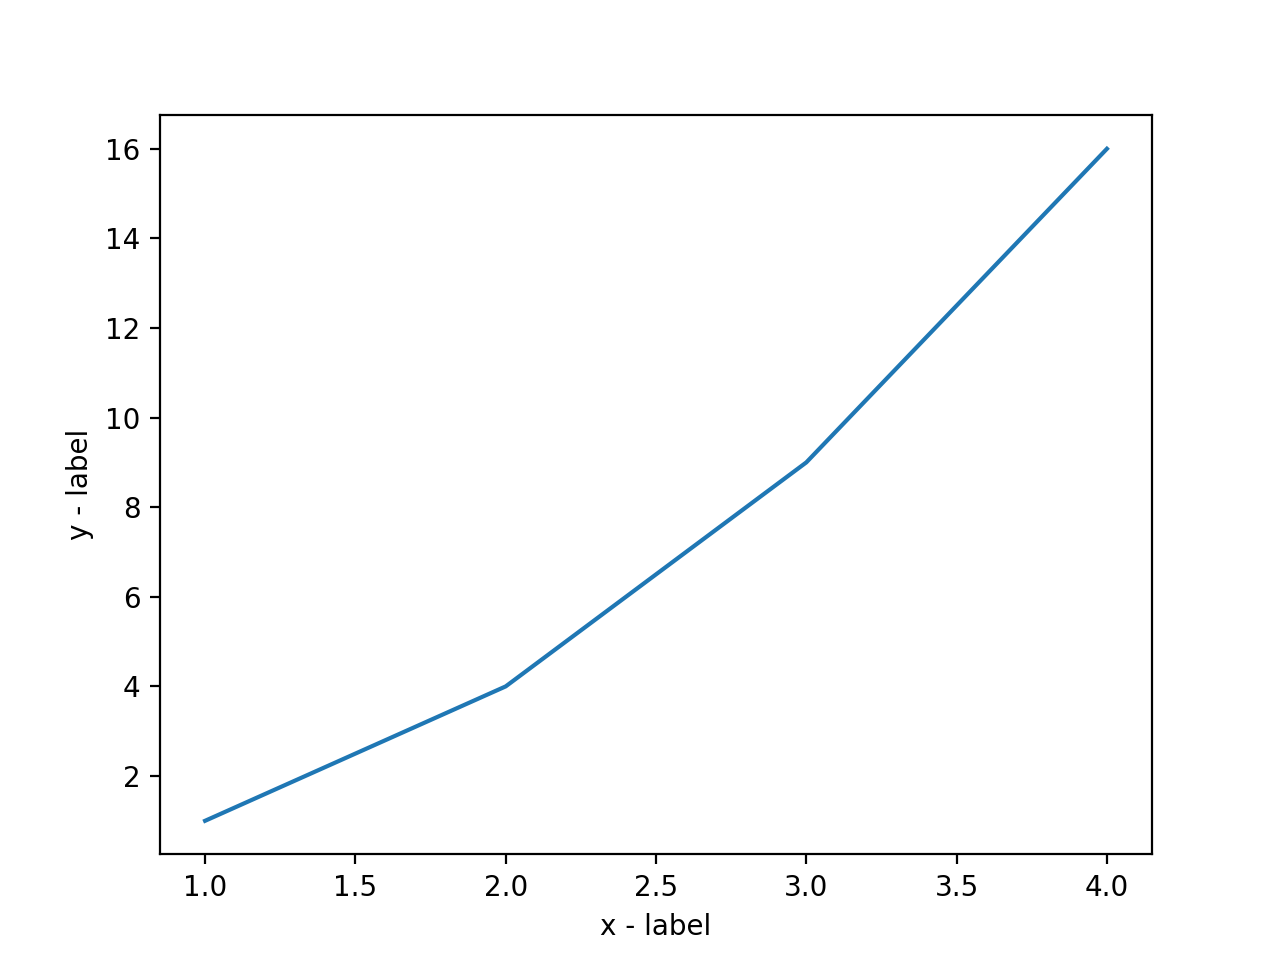
The displayed result is as follows:
Title
We can usetitle()method to set the title.
Example
import matplotlib.pyplot as plt
x = np.array([1, 2, 3, 4])
y = np.array([1, 4, 9, 16])
plt.plot(x, y)
plt.title("EXAMPLE TEST TITLE")
plt.xlabel("x - label")
plt.ylabel("y - label")
plt.show()
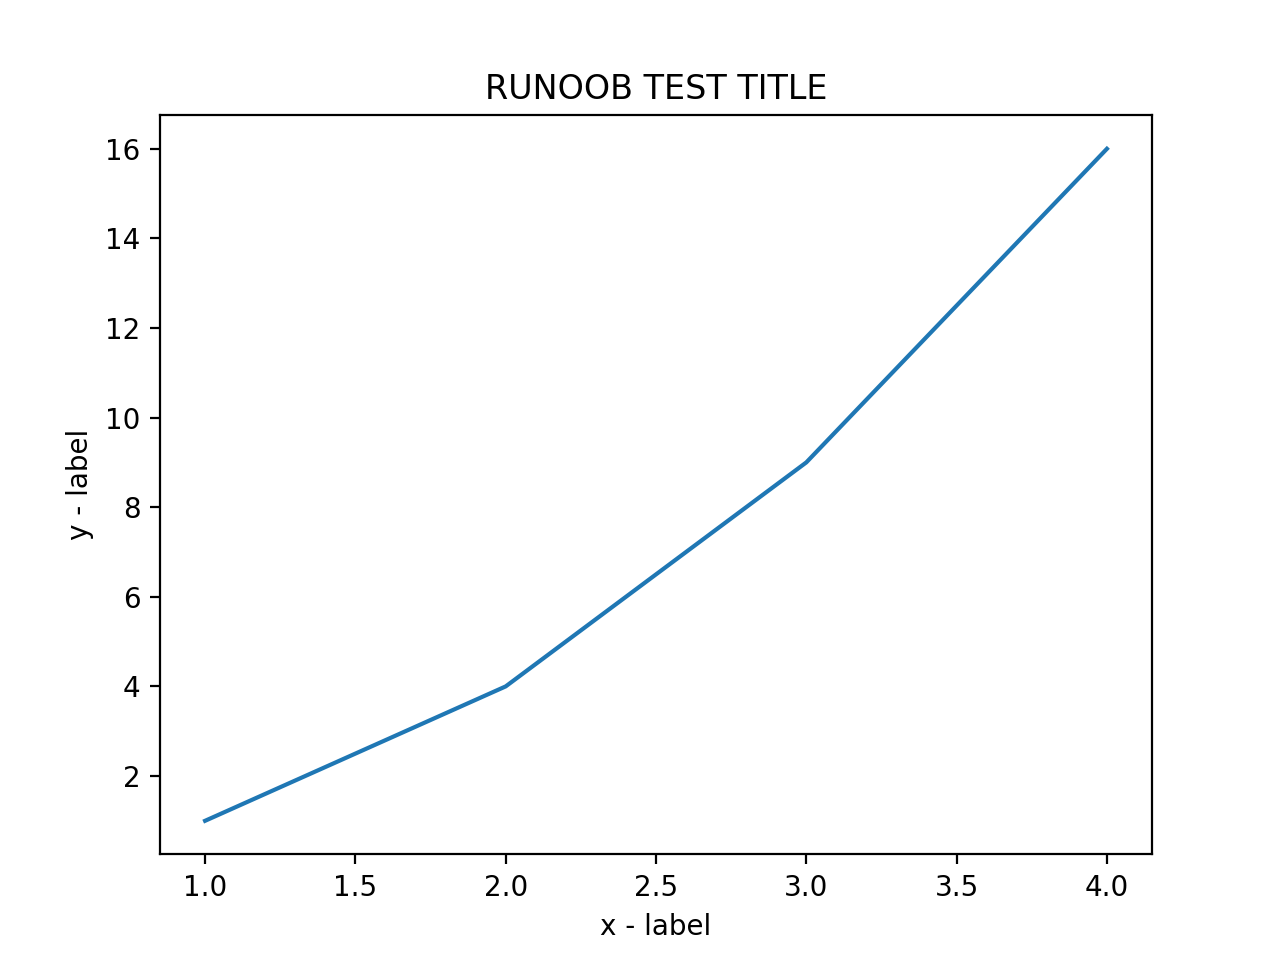
The displayed result is as follows:
Displaying Chinese in Plots
By default, Matplotlib does not support Chinese. We can use the following simple methods to solve this.
Here we use Source Han Sans (Noto Sans CJK), an open-source font released by Adobe and Google.
Official website:https://source.typekit.com/source-han-serif/cn/
GitHub address:https://github.com/adobe-fonts/source-han-sans/tree/release/OTF/SimplifiedChinese
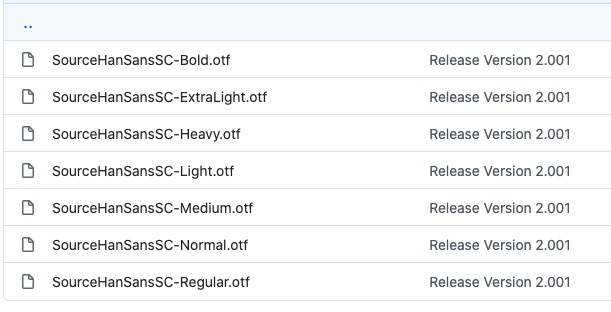
After opening the link, just pick one from it:
You can also download from the cloud drive:https://pan.baidu.com/s/10-w1JbXZSnx3Tm6uGpPGOw, extraction code:yxqu。
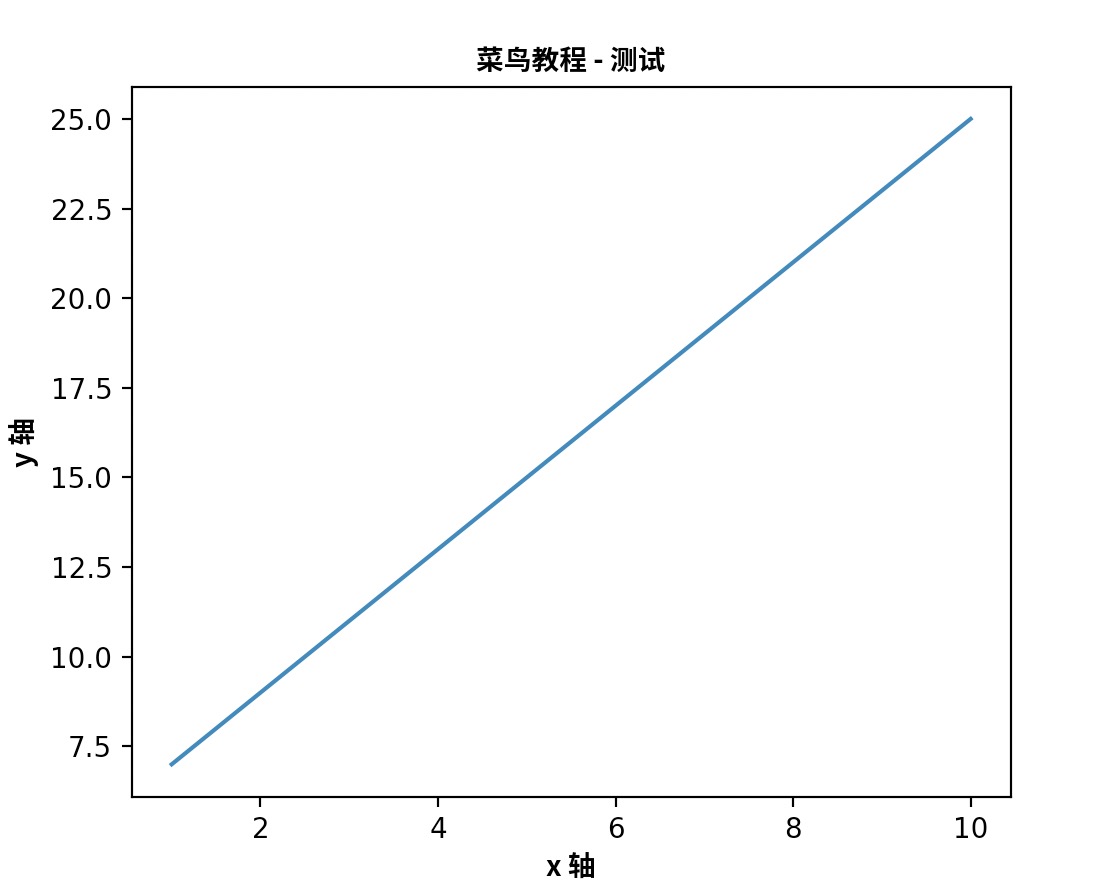
You can download an OTF font, such as SourceHanSansSC-Bold.otf, and place the file in the same directory as the currently executing code:
Put the SourceHanSansSC-Bold.otf file in the directory of the currently executing code:
Example
The output after execution is shown in the figure below:
In addition, we can also use system fonts:
from matplotlib import pyplot as plt
import matplotlib
a=sorted([f.name for f in matplotlib.font_manager.fontManager.ttflist])

for i in a:
    print(i)
Print out all registered names in your font_manager's ttflist, find a Chinese font such as STFangsong (仿宋), Heiti TC (blackbody), then add the following code:
plt.rcParams['font.family']=['STFangsong']
In addition, we can also customize the font style:
Example
from matplotlib import pyplot as plt
import matplotlib
# fname is the path to the font library you downloaded, note the path of the SourceHanSansSC-Bold.otf font, and the size parameter sets the font size
zhfont1 = matplotlib.font_manager.FontProperties(fname="SourceHanSansSC-Bold.otf", size=18)
font1 = {'color':'blue','size':20}
font2 = {'color':'darkred','size':15}
x = np.arange(1,11)
y = 2 * x + 5
# fontdict can use CSS to set the font style
plt.title("Example Tutorial - Test", fontproperties=zhfont1, fontdict = font1)
# fontproperties sets Chinese display, fontsize sets font size
plt.xlabel("x-axis", fontproperties=zhfont1)
plt.ylabel("y-axis", fontproperties=zhfont1)
plt.plot(x,y)
plt.show()
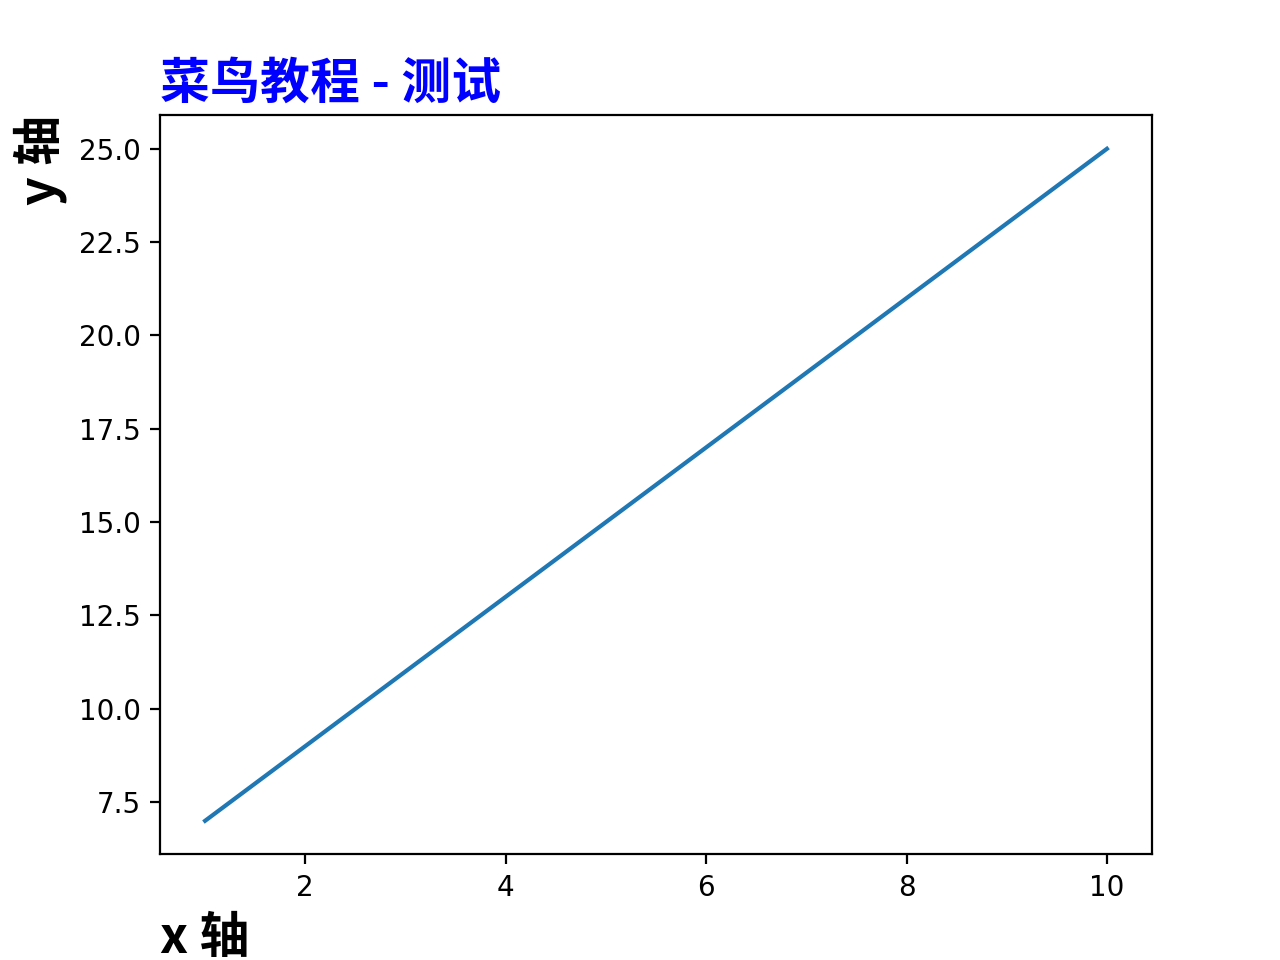
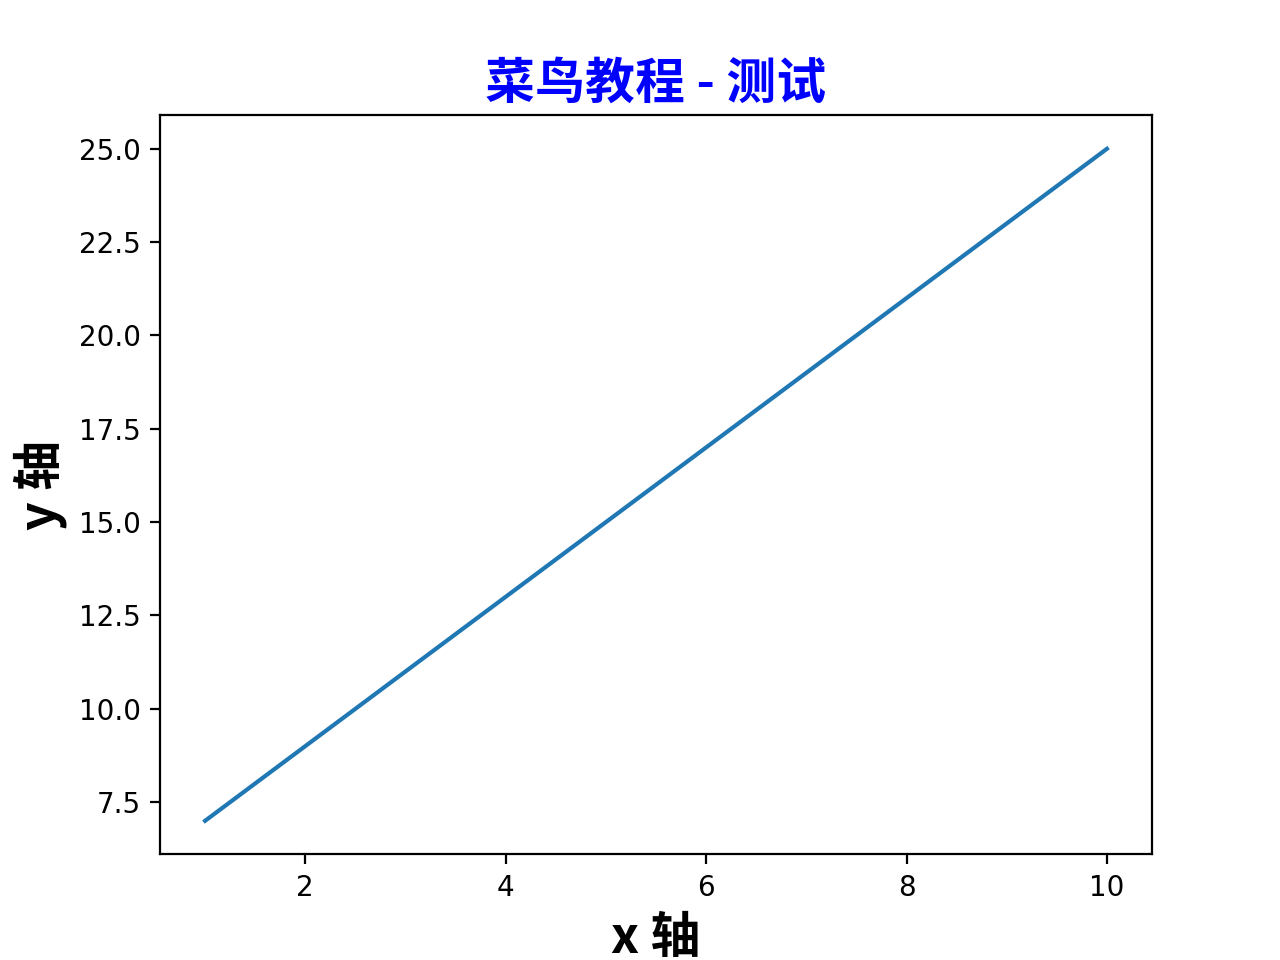
The output result is as follows:
Positioning of Title and Labels
title()The method provideslocparameter to set the position of the title display. It can be set to:'left', 'right', and 'center'. The default is 'center'.。
xlabel()The method provideslocparameter to set the position of the x-axis display. It can be set to:'left', 'right', and 'center'. The default is 'center'.。
ylabel()The method provideslocparameter to set the position of the y-axis display. It can be set to:'bottom', 'top', and 'center'. The default is 'center'.。
Example
from matplotlib import pyplot as plt
import matplotlib
# fname is the path to the font library you downloaded, note the path of the SourceHanSansSC-Bold.otf font, and the size parameter sets the font size
zhfont1 = matplotlib.font_manager.FontProperties(fname="SourceHanSansSC-Bold.otf", size=18)
font1 = {'color':'blue','size':20}
font2 = {'color':'darkred','size':15}
x = np.arange(1,11)
y = 2 * x + 5
# fontdict can use CSS to set the font style
plt.title("Example Tutorial - Test", fontproperties=zhfont1, fontdict = font1, loc="left")
# fontproperties sets Chinese display, fontsize sets font size
plt.xlabel("x-axis", fontproperties=zhfont1, loc="left")
plt.ylabel("y-axis", fontproperties=zhfont1, loc="top")
plt.plot(x,y)
plt.show()
The output result is as follows: