NumPy Matplotlib
Matplotlib is a plotting library for Python. It can be used with NumPy, providing an effective open-source alternative to MatLab. It can also be used with GUI toolkits such as PyQt and wxPython.
Installation with pip3:
pip3 install matplotlib -i https://pypi.tuna.tsinghua.edu.cn/simple
Linux systems can also use the Linux package manager to install:
Debian / Ubuntu:
sudo apt-get install python-matplotlib
Fedora / Redhat:
sudo yum install python-matplotlib
After installation, you can usepython -m pip listcommand to check whether the matplotlib module is installed.
$ pip3 list | grep matplotlib
matplotlib        3.3.0
Example
Example
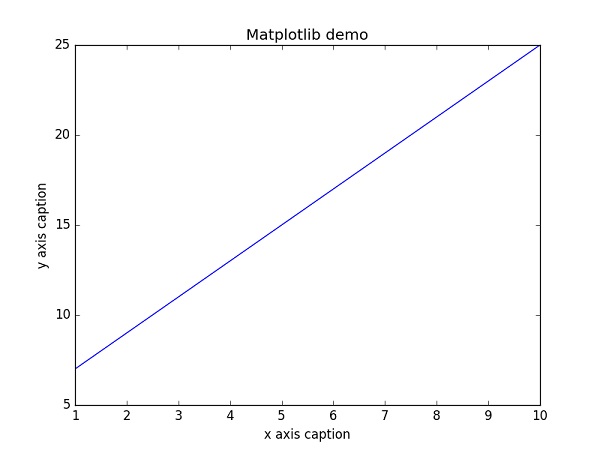
In the above example, the np.arange() function creates values on the x-axis. The corresponding values on the y-axis are stored in another array object, y. These values are plotted using the plot() function of the pyplot submodule of the matplotlib package.
The graph is displayed by the show() function.
Displaying Chinese in Graphs
Matplotlib does not support Chinese by default. We can use the following simple methods to solve this.
Here we use Source Han Sans, an open-source font released by Adobe and Google.
Official website:https://source.typekit.com/source-han-serif/cn/
GitHub address:https://github.com/adobe-fonts/source-han-sans/tree/release/OTF/SimplifiedChinese
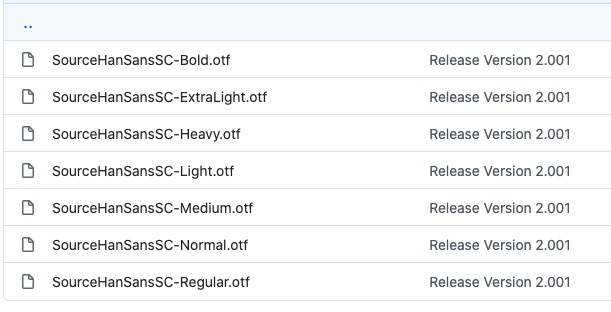
After opening the link, just choose one from inside:
You can also download from the cloud drive:https://pan.baidu.com/s/10-w1JbXZSnx3Tm6uGpPGOw, extraction code:yxqu。
You can download an OTF font, such as SourceHanSansSC-Bold.otf, and place this file in the directory of the currently executing code file:
Place the SourceHanSansSC-Bold.otf file in the directory of the currently executing code file:
Example
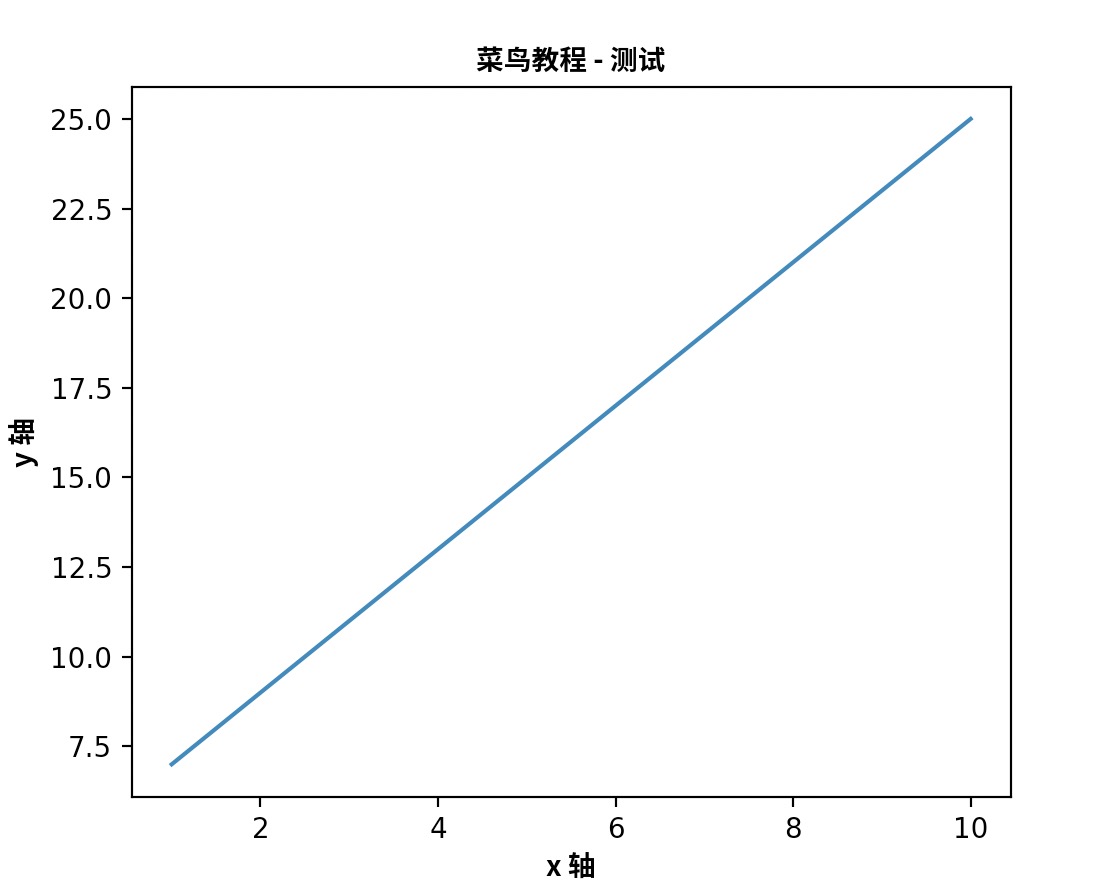
Executing the output results in the following figure:
In addition, we can also use system fonts:
from matplotlib import pyplot as plt
import matplotlib
a=sorted([f.name for f in matplotlib.font_manager.fontManager.ttflist])

for i in a:
    print(i)
Print out all registered names in the ttflist of your font_manager, find a Chinese font such as STFangsong (Fangsong), then add the following code:
plt.rcParams['font.family']=['STFangsong']
As an alternative to line graphs, discrete values can be displayed by adding a format string to the plot() function. The following formatting characters can be used.
| Character | Description |
|---|---|
'-' |
Solid line style |
'--' |
Dashed line style |
'-.' |
Dash-dot line style |
':' |
Dotted line style |
'.' |
Point marker |
',' |
Pixel marker |
'o' |
Circle marker |
'v' |
Inverted triangle marker |
'^' |
Upward triangle marker |
'<' |
Left triangle marker |
'>' |
Right triangle marker |
'1' |
Downward arrow marker |
'2' |
Upward arrow marker |
'3' |
Left arrow marker |
'4' |
Right arrow marker |
's' |
Square marker |
'p' |
Pentagon marker |
'*' |
Star marker |
'h' |
Hexagon marker 1 |
'H' |
Hexagon marker 2 |
'+' |
Plus marker |
'x' |
X marker |
'D' |
Diamond marker |
'd' |
Thin diamond marker |
'|' |
Vertical line marker |
'_' |
Horizontal line marker |
The following are color abbreviations:
| Character | Color |
|---|---|
'b' |
Blue |
'g' |
Green |
'r' |
Red |
'c' |
Cyan |
'm' |
Magenta |
'y' |
Yellow |
'k' |
Black |
'w' |
White |
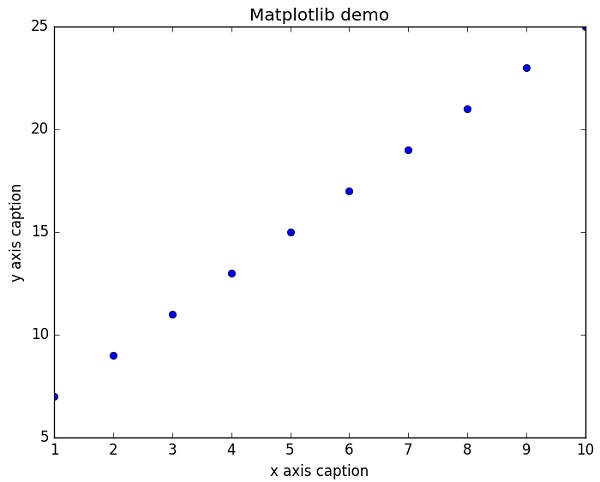
To display circles to represent points, instead of the lines in the above example, use 'ob' as the format string in the plot() function.
Example
Executing the output results in the following figure:
Plotting Sine Wave
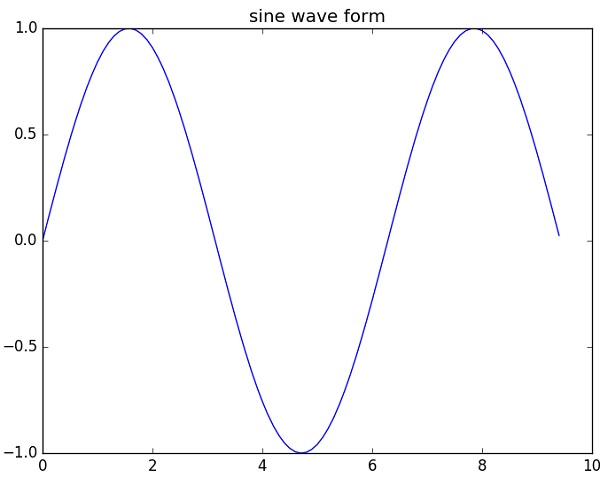
The following example uses matplotlib to generate a sine wave graph.
Example
Executing the output results in the following figure:
subplot()
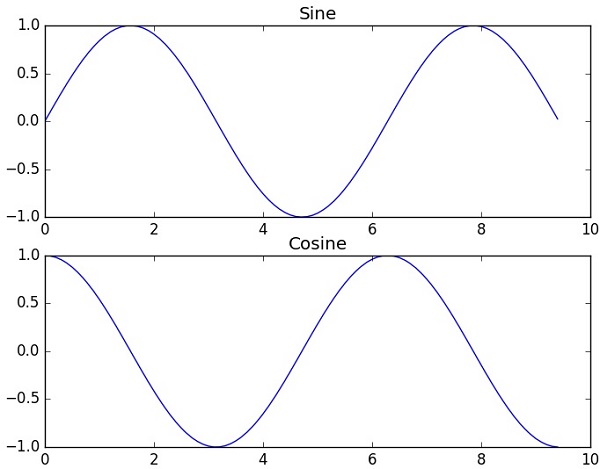
The subplot() function allows you to plot different things in the same figure.
The following example plots sine and cosine values:
Example
Executing the output results in the following figure:
bar()
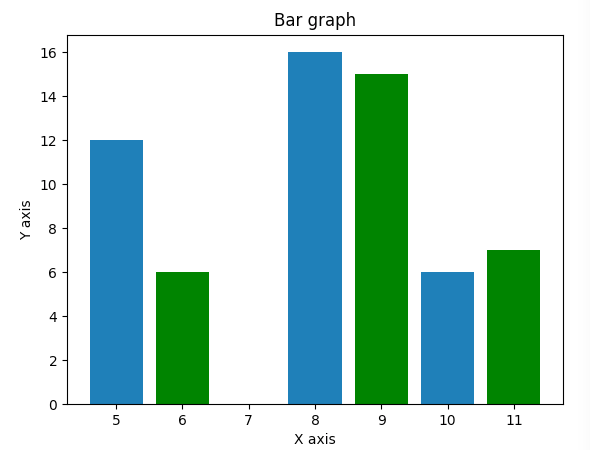
The pyplot submodule provides the bar() function to generate bar charts.
The following example generates bar charts for two sets of x and y arrays.
Example
Executing the output results in the following figure:
numpy.histogram()
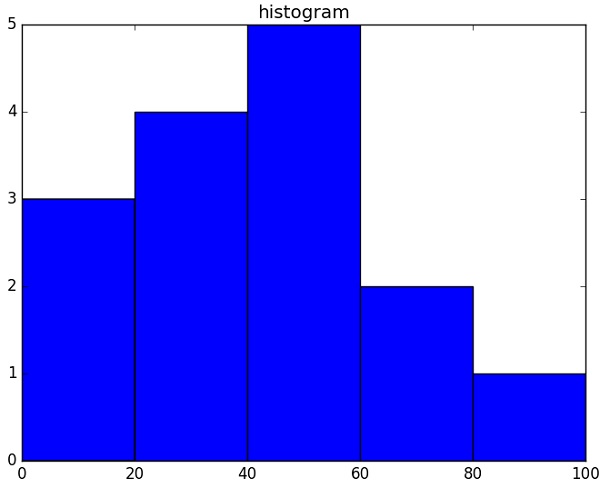
The numpy.histogram() function is a graphical representation of the frequency distribution of data. Rectangles with equal horizontal dimensions correspond to class intervals, called bins, and the variable height corresponds to the frequency.
The numpy.histogram() function takes the input array and bins as two parameters. Consecutive elements in the bins array are used as the boundaries of each bin.
Example
The output result is:
[3 4 5 2 1]
[  0  20  40  60  80 100]
plt()
Matplotlib can convert the numerical representation of a histogram into a graph. The plt() function of the pyplot submodule takes an array containing the data and a bins array as parameters and converts it into a histogram.
Example
Executing the output results in the following figure:
Other ExtensionsMore reference content on Matplotlib:
- Matplotlib Tutorial 1
- Matplotlib Tutorial 2
- User Guide
- Frequently Asked Questions and Answers
- Screenshots