ECharts Style Settings
ECharts can change the color, brightness, size, etc. of graphic elements or text through style settings.
Color Theme
Starting with ECharts 4, in addition to the default theme, two built-in themes are included, which arelightanddark。
Usage is as follows:
Example
Try it Yourself »
Additionally, we can also on the officialTheme editorChoose a theme you like and download it.
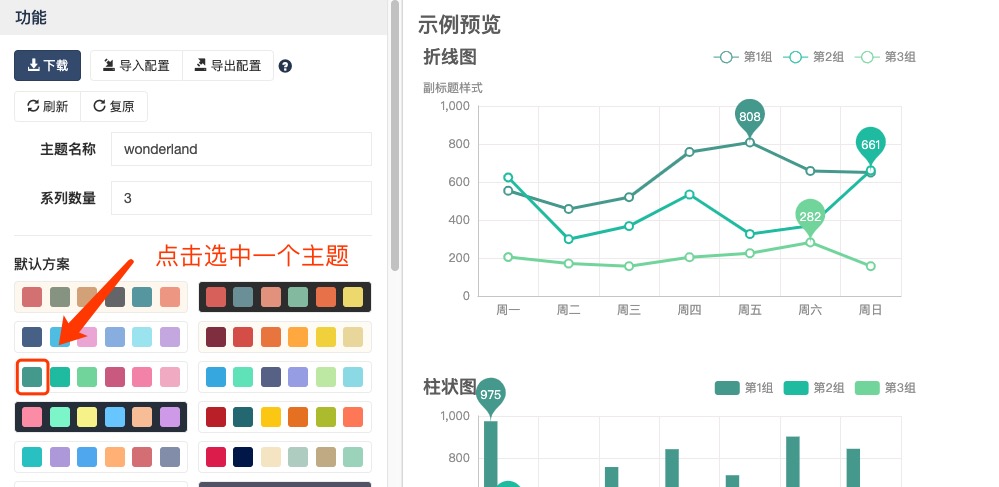
Currently, the theme download provides both a JS version and a JSON version.
If you use the JS version, you can save the JS theme code to athemeName.jsfile, then reference the file in HTML, and finally use the theme in your code.
For example, in the image above we selected a theme; save the JS code aswonderland.js。
Example
<script src="https://www.example.com/static/js/wonderland.js"></script>
...
//After including the wonderland.js file in HTML, call it during initialization.
var myChart = echarts.init(dom, 'wonderland');
// ...
Try it Yourself »
If the theme is saved as a JSON file, you can load and register it yourself.
For example, in the image above we selected a theme; save the JSON code aswonderland.json。
Example
$.getJSON('wonderland.json', function (themeJSON) {
echarts.registerTheme('wonderland', themeJSON)
var myChart = echarts.init(dom, 'wonderland');
});
Try it Yourself »
Note:We use $.getJSON, so jQuery needs to be included.
color palette
The color palette can be set in option.
The color palette provides a set of colors, and graphics and series will automatically select colors from it.
You can set a global color palette, or you can set a color palette exclusive to a series.
// Global color palette.
color: ['#c23531','#2f4554', '#61a0a8', '#d48265', '#6D9AC7','#5B80A6', '#ca8622', '#bda29a','#6e7074', '#546570', '#c4ccd3'],
series: [{
type: 'bar',
// This series' own color palette.
color: ['#dd6b66','#759aa0','#e69d87','#6A96C1','#ea7e53','#eedd78','#5B80A6','#73b9bc','#7289ab', '#6F9DCA','#f49f42'],
...
}, {
type: 'pie',
// This series' own color palette.
color: ['#37A2DA', '#32C5E9', '#67E0E3', '#7FB2E6', '#FFDB5C','#ff9f7f', '#fb7293', '#E062AE', '#E690D1', '#e7bcf3', '#9d96f5', '#8378EA', '#96BFFF'],
...
}]
}
Global color palette examples:
Example
color: ['#ff0000','#0080FF', '#0000ff', '#d48265', '#6D9AC7','#5B80A6', '#ca8622', '#bda29a','#6e7074', '#546570', '#c4ccd3'],
Try it Yourself »
Series color palette examples:
Example
type: 'pie',
// This series' own color palette.
color: ['#ff0000','#0080FF', '#0000ff', '#7FB2E6', '#FFDB5C','#ff9f7f', '#fb7293', '#E062AE', '#E690D1', '#e7bcf3', '#9d96f5', '#8378EA', '#96BFFF'],
...
}]
Try it Yourself »
Direct style settings: itemStyle, lineStyle, areaStyle, label, ...
Direct style setting is a relatively common way of setting. Looking across ECharts'optionIn many places, you can setitemStyle、lineStyle、areaStyle、labeletc. In these places, you can directly set the color, line width, point size, label text, label style, etc. of graphic elements.
Generally speaking, all series and components of ECharts follow these naming conventions, although in different charts and components,itemStyle、labeletc. may appear in different places.
For another introduction to direct style setting, seeECharts pie chart。
Highlight style: emphasis
When the mouse hovers over a graphic element, a highlighted style generally appears. By default, the highlighted style is automatically generated based on the normal style.
If you want to customize the highlight style, you can customize it through the emphasis property:
Example
emphasis: {
itemStyle: {
// Color of the point when highlighted.
color: 'red'
},
label: {
show: true,
// The label text when highlighted
formatter: 'Label content displayed when highlighted'
}
},
Try it Yourself »