Dash Introduction
Dash is an open-source Python-based framework specifically designed for building web applications for data analysis and data visualization.
Dash was developed by the Plotly team to help data analysts, data scientists, and developers quickly create interactive, data-driven web applications without needing in-depth knowledge of front-end technologies (such as HTML, CSS, and JavaScript).
Dash's core strengths lie in its simplicity and powerful functionality. With Dash, users can build complex web applications using pure Python code without writing cumbersome frontend code. A Dash application typically consists of two main parts:Layoutandinteractivity。
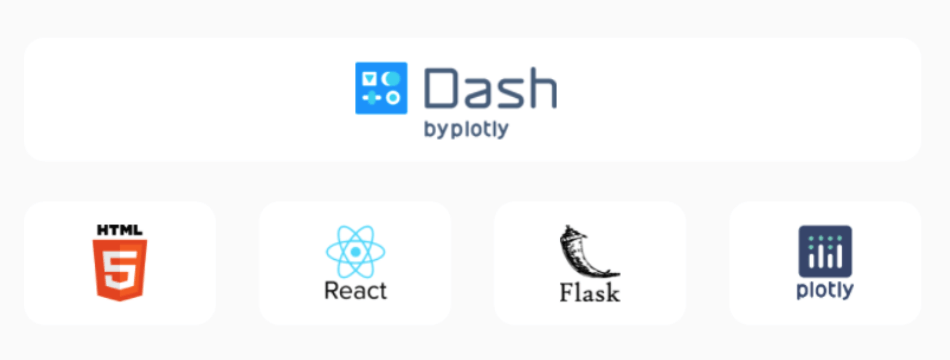
Dash combines Flask's backend capabilities, Plotly.js's visualization capabilities, and React.js's interactive capabilities, providing users with a simple and powerful development platform.
Simple and easy to use
-
You can build web applications with just Python code, no frontend development experience required.
-
The syntax is intuitive, and the learning curve is gentle.
Highly customizable
-
Supports custom layouts and styles.
-
Custom components can be created through React.js.
Highly interactive
-
Built-in callback mechanism makes it easy to implement user interactions.
-
Supports dynamic updates of data and charts.
Seamless integration with data science tools
-
Integrates perfectly with data science libraries such as Pandas, NumPy, and Scikit-learn.
-
Use Plotly to create rich visualization charts.
Cross-platform
-
Can be run locally or deployed to a server or cloud platform.
Dash tech stack
Dash is not a completely independent framework; it is built on the following technologies:
Flask
-
Dash's backend is based on Flask, a lightweight Python web framework.
-
Flask handles HTTP requests and responses.
Plotly.js
-
Dash uses Plotly.js to render interactive charts.
-
Plotly.js supports multiple chart types, such as line charts, bar charts, scatter plots, heatmaps, etc.
React.js
-
Dash's frontend components are based on React.js, a popular JavaScript library.
-
React.js enables Dash components to update dynamically without refreshing the page.
Other dependencies
-
Dash also depends on other Python libraries, such as Pandas (data processing), NumPy (numerical computation), and others.
Dash core components
1. Layout
1. Import method Inlatest versionof Dash Among them,RecommendedwithBottomMethodImportCore components: python Copy from dash import Dash, html, dccThe layout defines the appearance and structure of the application. In Dash, the layout is described in Python code, usingdash_html_componentsanddash_core_componentsthese two libraries to create HTML elements and interactive components.
dash_html_components: This library provides Python classes corresponding to HTML tags. For example,html.DivCorrespond to those in HTML<div>label,html.H1corresponding<h1>tags, etc. With these components, you can easily build the structure of the page.dash_core_components: This library provides more advanced interactive components, such as sliders, dropdown menus, graphs, etc. For example,dcc.Graphis used to display Plotly charts,dcc.DropdownUsed to create dropdown menus.
from Dash 2.0 Versionstart,dash_html_components and dash_core_components alreadyBy整combineto dash mainPackageIn.
It is now recommended to import html and dcc directly from dash, rather than using the old dash_html_components and dash_core_components.
The following are the updated import methods and usage for Dash core components:
from dash import Dash, html, dcc
html: replaces the originaldash_html_components, used to create HTML elements.dcc: replaces the originaldash_core_components, used to create interactive components.
2. Interactivity
Dash's interactivity is achieved through callback functions. Callback functions allow you to dynamically update page content when users interact with the application. For example, when a user selects a dropdown menu option, the chart can automatically update to display the corresponding data.
Callback functions are one of the core mechanisms of Dash applications. They work through@app.callbackDefined by decorators, and specify inputs and outputs. Inputs are usually components with which users interact (such as sliders, dropdown menus, etc.), while outputs are components that need to be updated (such as charts, text, etc.).
Dash application scenarios
- Data visualization: Create interactive charts and dashboards to display data analysis results.
- Machine learning model demonstration: Deploy machine learning models and interact with users through a web interface.
- Real-time data monitoring: Monitor real-time data streams (such as sensor data, stock prices, etc.).
- Report generation: Automatically generate dynamic reports, supporting user interaction and filtering.
- Internal tool development: Develop data-driven tools and applications for internal enterprise use.
Advantages and limitations of Dash
Advantages
Rapid development: Build web applications with Python code, high development efficiency.
Highly interactive: supports dynamic updates and user interaction.
Community Support: Has an active community and rich documentation.
Extensibility: Supports custom components and advanced features.
limitations
Performance bottleneck: For very complex applications, performance issues may be encountered.
Limited front-end customization: Although custom components are supported, complex frontend logic still requires JavaScript.
Learning Curve: Although simple and easy to use, mastering advanced features still takes some time.
Comparison of Dash with other tools
| Tools | Advantages | Disadvantages | Applicable scenarios |
|---|---|---|---|
| Dash | Simple and easy to use, suitable for Python developers. | Limited front-end customization, performance may be limited. | Data visualization, internal tools |
| Streamlit | Minimalist API, suitable for rapid prototyping. | Relatively simple functionality, not suitable for complex applications. | Rapid prototyping, simple dashboards |
| Flask | Highly flexible, suitable for full-stack development | Requires frontend development experience, lower development efficiency. | Full-stack web applications |
| Shiny (R) | Suitable for R language developers, strong interactivity. | Limited to R language, smaller ecosystem. | Data visualization for R language users |